1996 Presidential General Election Data Graphs - Massachusetts
by County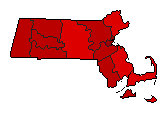
| Barnstable | Clinton | 53.5% | |
| Dole | 36.3% | |
| Perot | 8.9% | |
| Other | 1.3% | |
| Berkshire | Clinton | 64.7% | |
| Dole | 21.5% | |
| Perot | 12.5% | |
| Other | 1.3% | |
| Bristol | Clinton | 64.4% | |
| Dole | 23.8% | |
| Perot | 10.8% | |
| Other | 1.0% | |
| Dukes | Clinton | 66.7% | |
| Dole | 22.6% | |
| Perot | 8.5% | |
| Other | 2.2% | |
| Essex | Clinton | 58.7% | |
| Dole | 30.6% | |
| Perot | 9.3% | |
| Other | 1.5% | |
| Franklin | Clinton | 60.3% | |
| Dole | 24.6% | |
| Perot | 11.8% | |
| Other | 3.4% | |
| Hampden | Clinton | 61.0% | |
| Dole | 28.2% | |
| Perot | 9.8% | |
| Other | 1.0% | |
| Hampshire | Clinton | 64.1% | |
| Dole | 22.6% | |
| Perot | 10.1% | |
| Other | 3.2% | |
| Middlesex | Clinton | 63.4% | |
| Dole | 27.1% | |
| Perot | 7.7% | |
| Other | 1.9% | |
| Nantucket | Clinton | 59.0% | |
| Dole | 29.4% | |
| Perot | 9.6% | |
| Other | 2.0% | |
| Norfolk | Clinton | 60.1% | |
| Dole | 30.9% | |
| Perot | 7.6% | |
| Other | 1.3% | |
| Plymouth | Clinton | 54.7% | |
| Dole | 33.3% | |
| Perot | 10.7% | |
| Other | 1.3% | |
| Suffolk | Clinton | 73.0% | |
| Dole | 19.9% | |
| Perot | 5.5% | |
| Other | 1.5% | |
| Worcester | Clinton | 58.3% | |
| Dole | 29.8% | |
| Perot | 10.3% | |
| Other | 1.6% | |