2012 Referendum General Election Data Graphs - Minnesota
by CountyData for this Contest was Contributed by on 2012-11-17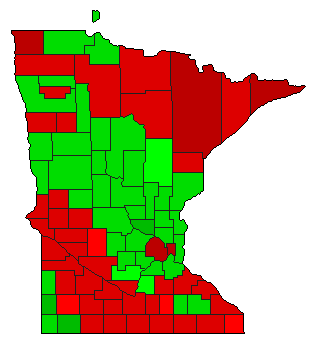
| Aitkin | No | 48.8% | |
| Yes | 50.0% | |
| Other | 1.2% | |
| Anoka | No | 45.1% | |
| Yes | 53.6% | |
| Other | 1.3% | |
| Becker | No | 44.9% | |
| Yes | 53.3% | |
| Other | 1.8% | |
| Beltrami | No | 53.0% | |
| Yes | 45.4% | |
| Other | 1.6% | |
| Benton | No | 43.4% | |
| Yes | 55.1% | |
| Other | 1.5% | |
| Big Stone | No | 56.8% | |
| Yes | 41.9% | |
| Other | 1.3% | |
| Blue Earth | No | 54.6% | |
| Yes | 43.6% | |
| Other | 1.8% | |
| Brown | No | 53.1% | |
| Yes | 45.7% | |
| Other | 1.2% | |
| Carlton | No | 56.5% | |
| Yes | 42.2% | |
| Other | 1.4% | |
| Carver | No | 42.9% | |
| Yes | 56.0% | |
| Other | 1.1% | |
| Cass | No | 44.9% | |
| Yes | 53.7% | |
| Other | 1.4% | |
| Chippewa | No | 57.3% | |
| Yes | 41.5% | |
| Other | 1.2% | |
| Chisago | No | 42.8% | |
| Yes | 56.2% | |
| Other | 1.1% | |
| Clay | No | 42.6% | |
| Yes | 55.2% | |
| Other | 2.1% | |
| Clearwater | No | 43.2% | |
| Yes | 54.9% | |
| Other | 1.9% | |
| Cook | No | 63.9% | |
| Yes | 34.5% | |
| Other | 1.6% | |
| Cottonwood | No | 54.3% | |
| Yes | 45.5% | |
| Other | 0.3% | |
| Crow Wing | No | 44.2% | |
| Yes | 54.6% | |
| Other | 1.2% | |
| Dakota | No | 48.6% | |
| Yes | 50.1% | |
| Other | 1.4% | |
| Dodge | No | 46.8% | |
| Yes | 52.1% | |
| Other | 1.1% | |
| Douglas | No | 46.4% | |
| Yes | 52.6% | |
| Other | 1.0% | |
| Faribault | No | 53.8% | |
| Yes | 45.0% | |
| Other | 1.1% | |
| Fillmore | No | 59.0% | |
| Yes | 39.6% | |
| Other | 1.4% | |
| Freeborn | No | 51.9% | |
| Yes | 46.6% | |
| Other | 1.5% | |
| Goodhue | No | 50.0% | |
| Yes | 48.7% | |
| Other | 1.3% | |
| Grant | No | 53.3% | |
| Yes | 45.7% | |
| Other | 1.1% | |
| Hennepin | No | 60.2% | |
| Yes | 37.7% | |
| Other | 2.2% | |
| Houston | No | 49.1% | |
| Yes | 48.9% | |
| Other | 2.0% | |
| Hubbard | No | 46.8% | |
| Yes | 52.0% | |
| Other | 1.2% | |
| Isanti | No | 40.6% | |
| Yes | 58.2% | |
| Other | 1.3% | |
| Itasca | No | 58.0% | |
| Yes | 40.9% | |
| Other | 1.1% | |
| Jackson | No | 50.5% | |
| Yes | 48.2% | |
| Other | 1.3% | |
| Kanabec | No | 46.4% | |
| Yes | 52.4% | |
| Other | 1.2% | |
| Kandiyohi | No | 50.0% | |
| Yes | 48.8% | |
| Other | 1.3% | |
| Kittson | No | 60.4% | |
| Yes | 37.2% | |
| Other | 2.5% | |
| Koochiching | No | 54.8% | |
| Yes | 43.3% | |
| Other | 1.9% | |
| Lac Qui Parle | No | 59.9% | |
| Yes | 39.1% | |
| Other | 1.0% | |
| Lake | No | 58.4% | |
| Yes | 40.3% | |
| Other | 1.3% | |
| Lake of the Woods | No | 44.9% | |
| Yes | 52.6% | |
| Other | 2.5% | |
| Le Sueur | No | 49.3% | |
| Yes | 49.5% | |
| Other | 1.2% | |
| Lincoln | No | 46.8% | |
| Yes | 50.7% | |
| Other | 2.5% | |
| Lyon | No | 50.2% | |
| Yes | 48.6% | |
| Other | 1.2% | |
| McLeod | No | 44.8% | |
| Yes | 54.2% | |
| Other | 1.0% | |
| Mahnomen | No | 51.8% | |
| Yes | 45.8% | |
| Other | 2.5% | |
| Marshall | No | 50.3% | |
| Yes | 43.9% | |
| Other | 5.9% | |
| Martin | No | 52.9% | |
| Yes | 45.8% | |
| Other | 1.4% | |
| Meeker | No | 49.1% | |
| Yes | 50.0% | |
| Other | 0.8% | |
| Mille Lacs | No | 45.4% | |
| Yes | 53.3% | |
| Other | 1.3% | |
| Morrison | No | 42.2% | |
| Yes | 56.5% | |
| Other | 1.3% | |
| Mower | No | 50.9% | |
| Yes | 47.5% | |
| Other | 1.6% | |
| Murray | No | 49.5% | |
| Yes | 49.0% | |
| Other | 1.5% | |
| Nicollet | No | 57.5% | |
| Yes | 41.0% | |
| Other | 1.5% | |
| Nobles | No | 36.6% | |
| Yes | 60.8% | |
| Other | 2.6% | |
| Norman | No | 52.0% | |
| Yes | 45.4% | |
| Other | 2.6% | |
| Olmsted | No | 46.6% | |
| Yes | 51.6% | |
| Other | 1.8% | |
| Otter Tail | No | 42.5% | |
| Yes | 55.6% | |
| Other | 1.9% | |
| Pennington | No | 46.9% | |
| Yes | 51.5% | |
| Other | 1.6% | |
| Pine | No | 47.8% | |
| Yes | 50.9% | |
| Other | 1.3% | |
| Pipestone | No | 34.7% | |
| Yes | 63.3% | |
| Other | 2.1% | |
| Polk | No | 42.5% | |
| Yes | 55.1% | |
| Other | 2.4% | |
| Pope | No | 54.0% | |
| Yes | 44.7% | |
| Other | 1.3% | |
| Ramsey | No | 61.8% | |
| Yes | 35.9% | |
| Other | 2.3% | |
| Red Lake | No | 50.7% | |
| Yes | 47.1% | |
| Other | 2.2% | |
| Redwood | No | 51.2% | |
| Yes | 47.4% | |
| Other | 1.4% | |
| Renville | No | 56.1% | |
| Yes | 42.9% | |
| Other | 1.0% | |
| Rice | No | 54.4% | |
| Yes | 44.1% | |
| Other | 1.5% | |
| Rock | No | 40.0% | |
| Yes | 57.7% | |
| Other | 2.3% | |
| Roseau | No | 42.3% | |
| Yes | 55.5% | |
| Other | 2.1% | |
| St. Louis | No | 61.0% | |
| Yes | 37.6% | |
| Other | 1.4% | |
| Scott | No | 41.9% | |
| Yes | 56.6% | |
| Other | 1.4% | |
| Sherburne | No | 38.5% | |
| Yes | 60.3% | |
| Other | 1.2% | |
| Sibley | No | 48.8% | |
| Yes | 49.9% | |
| Other | 1.3% | |
| Stearns | No | 45.7% | |
| Yes | 52.9% | |
| Other | 1.3% | |
| Steele | No | 50.0% | |
| Yes | 48.7% | |
| Other | 1.3% | |
| Stevens | No | 55.9% | |
| Yes | 42.8% | |
| Other | 1.3% | |
| Swift | No | 56.9% | |
| Yes | 38.3% | |
| Other | 4.8% | |
| Todd | No | 43.5% | |
| Yes | 55.1% | |
| Other | 1.4% | |
| Traverse | No | 54.0% | |
| Yes | 44.1% | |
| Other | 1.9% | |
| Wabasha | No | 50.5% | |
| Yes | 48.0% | |
| Other | 1.6% | |
| Wadena | No | 41.4% | |
| Yes | 57.2% | |
| Other | 1.4% | |
| Waseca | No | 54.2% | |
| Yes | 44.6% | |
| Other | 1.2% | |
| Washington | No | 48.1% | |
| Yes | 50.7% | |
| Other | 1.3% | |
| Watonwan | No | 54.1% | |
| Yes | 44.6% | |
| Other | 1.3% | |
| Wilkin | No | 39.7% | |
| Yes | 58.3% | |
| Other | 1.9% | |
| Winona | No | 51.8% | |
| Yes | 46.2% | |
| Other | 2.0% | |
| Wright | No | 39.9% | |
| Yes | 58.7% | |
| Other | 1.3% | |
| Yellow Medicine | No | 55.7% | |
| Yes | 43.0% | |
| Other | 1.3% | |