2012 Presidential General Election Data Graphs - Nebraska
by County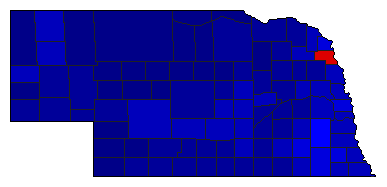
| Adams | Obama | 32.1% | |
| Romney | 65.6% | |
| Other | 2.3% | |
| Antelope | Obama | 17.7% | |
| Romney | 80.3% | |
| Other | 2.0% | |
| Arthur | Obama | 11.5% | |
| Romney | 86.6% | |
| Other | 1.9% | |
| Banner | Obama | 13.4% | |
| Romney | 84.2% | |
| Other | 2.4% | |
| Blaine | Obama | 9.6% | |
| Romney | 88.4% | |
| Other | 2.0% | |
| Boone | Obama | 21.9% | |
| Romney | 76.2% | |
| Other | 1.9% | |
| Box Butte | Obama | 36.0% | |
| Romney | 61.0% | |
| Other | 3.1% | |
| Boyd | Obama | 17.6% | |
| Romney | 81.5% | |
| Other | 0.9% | |
| Brown | Obama | 14.4% | |
| Romney | 83.7% | |
| Other | 1.9% | |
| Buffalo | Obama | 27.6% | |
| Romney | 69.8% | |
| Other | 2.7% | |
| Burt | Obama | 38.3% | |
| Romney | 60.1% | |
| Other | 1.6% | |
| Butler | Obama | 27.1% | |
| Romney | 71.0% | |
| Other | 2.0% | |
| Cass | Obama | 35.9% | |
| Romney | 62.0% | |
| Other | 2.1% | |
| Cedar | Obama | 22.1% | |
| Romney | 75.6% | |
| Other | 2.3% | |
| Chase | Obama | 13.6% | |
| Romney | 84.8% | |
| Other | 1.6% | |
| Cherry | Obama | 14.2% | |
| Romney | 83.5% | |
| Other | 2.3% | |
| Cheyenne | Obama | 23.3% | |
| Romney | 74.2% | |
| Other | 2.5% | |
| Clay | Obama | 22.6% | |
| Romney | 75.7% | |
| Other | 1.6% | |
| Colfax | Obama | 31.6% | |
| Romney | 66.8% | |
| Other | 1.6% | |
| Cuming | Obama | 25.9% | |
| Romney | 72.3% | |
| Other | 1.7% | |
| Custer | Obama | 19.7% | |
| Romney | 78.1% | |
| Other | 2.2% | |
| Dakota | Obama | 47.6% | |
| Romney | 50.4% | |
| Other | 2.0% | |
| Dawes | Obama | 30.4% | |
| Romney | 66.5% | |
| Other | 3.2% | |
| Dawson | Obama | 28.0% | |
| Romney | 69.5% | |
| Other | 2.5% | |
| Deuel | Obama | 21.1% | |
| Romney | 75.0% | |
| Other | 3.8% | |
| Dixon | Obama | 32.4% | |
| Romney | 65.0% | |
| Other | 2.6% | |
| Dodge | Obama | 37.9% | |
| Romney | 60.2% | |
| Other | 1.9% | |
| Douglas | Obama | 47.5% | |
| Romney | 50.6% | |
| Other | 1.9% | |
| Dundy | Obama | 17.9% | |
| Romney | 80.4% | |
| Other | 1.7% | |
| Fillmore | Obama | 28.0% | |
| Romney | 69.7% | |
| Other | 2.3% | |
| Franklin | Obama | 25.0% | |
| Romney | 72.4% | |
| Other | 2.6% | |
| Frontier | Obama | 20.8% | |
| Romney | 77.2% | |
| Other | 2.1% | |
| Furnas | Obama | 18.9% | |
| Romney | 79.6% | |
| Other | 1.6% | |
| Gage | Obama | 40.4% | |
| Romney | 57.1% | |
| Other | 2.5% | |
| Garden | Obama | 22.2% | |
| Romney | 76.0% | |
| Other | 1.8% | |
| Garfield | Obama | 15.9% | |
| Romney | 81.8% | |
| Other | 2.3% | |
| Gosper | Obama | 23.5% | |
| Romney | 75.1% | |
| Other | 1.4% | |
| Grant | Obama | 8.3% | |
| Romney | 88.7% | |
| Other | 3.0% | |
| Greeley | Obama | 28.7% | |
| Romney | 69.2% | |
| Other | 2.1% | |
| Hall | Obama | 35.4% | |
| Romney | 62.5% | |
| Other | 2.1% | |
| Hamilton | Obama | 23.5% | |
| Romney | 73.9% | |
| Other | 2.6% | |
| Harlan | Obama | 19.9% | |
| Romney | 78.5% | |
| Other | 1.6% | |
| Hayes | Obama | 9.5% | |
| Romney | 88.3% | |
| Other | 2.2% | |
| Hitchcock | Obama | 18.3% | |
| Romney | 78.8% | |
| Other | 2.9% | |
| Holt | Obama | 17.9% | |
| Romney | 79.4% | |
| Other | 2.7% | |
| Hooker | Obama | 14.9% | |
| Romney | 83.5% | |
| Other | 1.5% | |
| Howard | Obama | 31.8% | |
| Romney | 65.9% | |
| Other | 2.3% | |
| Jefferson | Obama | 34.7% | |
| Romney | 62.9% | |
| Other | 2.5% | |
| Johnson | Obama | 38.3% | |
| Romney | 59.4% | |
| Other | 2.3% | |
| Kearney | Obama | 24.3% | |
| Romney | 73.9% | |
| Other | 1.8% | |
| Keith | Obama | 22.9% | |
| Romney | 75.0% | |
| Other | 2.1% | |
| Keya Paha | Obama | 16.5% | |
| Romney | 81.2% | |
| Other | 2.3% | |
| Kimball | Obama | 23.4% | |
| Romney | 73.2% | |
| Other | 3.4% | |
| Knox | Obama | 26.2% | |
| Romney | 71.5% | |
| Other | 2.3% | |
| Lancaster | Obama | 48.7% | |
| Romney | 49.0% | |
| Other | 2.3% | |
| Lincoln | Obama | 28.4% | |
| Romney | 68.5% | |
| Other | 3.0% | |
| Logan | Obama | 15.8% | |
| Romney | 82.6% | |
| Other | 1.6% | |
| Loup | Obama | 17.3% | |
| Romney | 81.0% | |
| Other | 1.7% | |
| McPherson | Obama | 14.1% | |
| Romney | 81.4% | |
| Other | 4.5% | |
| Madison | Obama | 25.1% | |
| Romney | 72.5% | |
| Other | 2.4% | |
| Merrick | Obama | 26.5% | |
| Romney | 71.4% | |
| Other | 2.1% | |
| Morrill | Obama | 20.8% | |
| Romney | 76.8% | |
| Other | 2.5% | |
| Nance | Obama | 29.7% | |
| Romney | 68.2% | |
| Other | 2.1% | |
| Nemaha | Obama | 35.1% | |
| Romney | 62.6% | |
| Other | 2.3% | |
| Nuckolls | Obama | 25.9% | |
| Romney | 71.8% | |
| Other | 2.2% | |
| Otoe | Obama | 36.7% | |
| Romney | 61.0% | |
| Other | 2.3% | |
| Pawnee | Obama | 29.8% | |
| Romney | 67.0% | |
| Other | 3.1% | |
| Perkins | Obama | 17.1% | |
| Romney | 81.4% | |
| Other | 1.5% | |
| Phelps | Obama | 20.1% | |
| Romney | 77.6% | |
| Other | 2.3% | |
| Pierce | Obama | 18.6% | |
| Romney | 78.9% | |
| Other | 2.5% | |
| Platte | Obama | 23.4% | |
| Romney | 74.7% | |
| Other | 2.0% | |
| Polk | Obama | 21.5% | |
| Romney | 76.9% | |
| Other | 1.6% | |
| Red Willow | Obama | 19.3% | |
| Romney | 78.8% | |
| Other | 1.9% | |
| Richardson | Obama | 31.9% | |
| Romney | 65.3% | |
| Other | 2.8% | |
| Rock | Obama | 13.1% | |
| Romney | 85.2% | |
| Other | 1.8% | |
| Saline | Obama | 46.2% | |
| Romney | 51.6% | |
| Other | 2.3% | |
| Sarpy | Obama | 37.3% | |
| Romney | 60.4% | |
| Other | 2.2% | |
| Saunders | Obama | 32.1% | |
| Romney | 65.7% | |
| Other | 2.3% | |
| Scotts Bluff | Obama | 30.3% | |
| Romney | 67.5% | |
| Other | 2.2% | |
| Seward | Obama | 31.5% | |
| Romney | 66.1% | |
| Other | 2.4% | |
| Sheridan | Obama | 15.8% | |
| Romney | 81.8% | |
| Other | 2.5% | |
| Sherman | Obama | 36.1% | |
| Romney | 60.6% | |
| Other | 3.3% | |
| Sioux | Obama | 13.7% | |
| Romney | 84.4% | |
| Other | 1.9% | |
| Stanton | Obama | 23.2% | |
| Romney | 73.7% | |
| Other | 3.1% | |
| Thayer | Obama | 27.4% | |
| Romney | 70.5% | |
| Other | 2.1% | |
| Thomas | Obama | 10.3% | |
| Romney | 88.2% | |
| Other | 1.5% | |
| Thurston | Obama | 56.3% | |
| Romney | 42.4% | |
| Other | 1.3% | |
| Valley | Obama | 22.7% | |
| Romney | 75.5% | |
| Other | 1.8% | |
| Washington | Obama | 30.6% | |
| Romney | 67.3% | |
| Other | 2.1% | |
| Wayne | Obama | 29.2% | |
| Romney | 67.7% | |
| Other | 3.1% | |
| Webster | Obama | 25.4% | |
| Romney | 72.2% | |
| Other | 2.4% | |
| Wheeler | Obama | 20.8% | |
| Romney | 77.0% | |
| Other | 2.2% | |
| York | Obama | 21.6% | |
| Romney | 76.7% | |
| Other | 1.7% | |