2000 Presidential General Election Data Graphs - Nevada
by County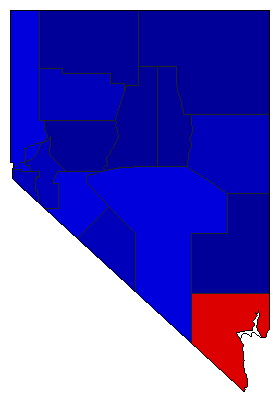
| Churchill | Gore | 24.8% | |
| Bush | 70.7% | |
| Nader | 2.1% | |
| Other | 2.3% | |
| Clark | Gore | 51.3% | |
| Bush | 44.7% | |
| Nader | 2.1% | |
| Other | 1.9% | |
| Douglas | Gore | 32.5% | |
| Bush | 62.3% | |
| Nader | 3.3% | |
| Other | 2.0% | |
| Elko | Gore | 17.9% | |
| Bush | 77.8% | |
| Nader | 1.6% | |
| Other | 2.8% | |
| Esmeralda | Gore | 23.6% | |
| Bush | 67.8% | |
| Nader | 2.9% | |
| Other | 5.7% | |
| Eureka | Gore | 17.9% | |
| Bush | 75.5% | |
| Nader | 1.8% | |
| Other | 4.8% | |
| Humboldt | Gore | 22.4% | |
| Bush | 72.3% | |
| Nader | 2.7% | |
| Other | 2.5% | |
| Lander | Gore | 18.6% | |
| Bush | 76.4% | |
| Nader | 1.7% | |
| Other | 3.2% | |
| Lincoln | Gore | 23.6% | |
| Bush | 70.1% | |
| Nader | 2.0% | |
| Other | 4.2% | |
| Lyon | Gore | 33.0% | |
| Bush | 60.6% | |
| Nader | 3.2% | |
| Other | 3.2% | |
| Mineral | Gore | 39.9% | |
| Bush | 53.5% | |
| Nader | 3.5% | |
| Other | 3.0% | |
| Nye | Gore | 37.1% | |
| Bush | 56.7% | |
| Nader | 2.7% | |
| Other | 3.4% | |
| Pershing | Gore | 26.4% | |
| Bush | 67.8% | |
| Nader | 2.6% | |
| Other | 3.3% | |
| Storey | Gore | 37.0% | |
| Bush | 56.4% | |
| Nader | 4.4% | |
| Other | 2.2% | |
| Washoe | Gore | 42.6% | |
| Bush | 52.0% | |
| Nader | 3.4% | |
| Other | 1.9% | |
| White Pine | Gore | 30.2% | |
| Bush | 63.1% | |
| Nader | 2.4% | |
| Other | 4.3% | |
City| Carson City | Gore | 37.8% | |
| Bush | 57.0% | |
| Nader | 3.1% | |
| Other | 2.1% | |