2000 Presidential General Election Data Graphs - New Hampshire
by County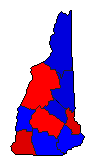
| Belknap | Gore | 40.0% | |
| Bush | 55.2% | |
| Nader | 3.6% | |
| Other | 1.1% | |
| Carroll | Gore | 41.3% | |
| Bush | 52.8% | |
| Nader | 4.5% | |
| Other | 1.4% | |
| Cheshire | Gore | 52.0% | |
| Bush | 41.3% | |
| Nader | 5.2% | |
| Other | 1.4% | |
| Coos | Gore | 45.0% | |
| Bush | 50.2% | |
| Nader | 3.2% | |
| Other | 1.6% | |
| Grafton | Gore | 47.3% | |
| Bush | 46.7% | |
| Nader | 4.6% | |
| Other | 1.4% | |
| Hillsborough | Gore | 46.8% | |
| Bush | 48.7% | |
| Nader | 3.3% | |
| Other | 1.2% | |
| Merrimack | Gore | 48.1% | |
| Bush | 47.2% | |
| Nader | 3.7% | |
| Other | 1.1% | |
| Rockingham | Gore | 45.9% | |
| Bush | 49.1% | |
| Nader | 3.9% | |
| Other | 1.1% | |
| Strafford | Gore | 51.4% | |
| Bush | 42.7% | |
| Nader | 4.6% | |
| Other | 1.2% | |
| Sullivan | Gore | 44.1% | |
| Bush | 49.8% | |
| Nader | 4.5% | |
| Other | 1.6% | |