2012 Presidential General Election Data Graphs - New Jersey
by County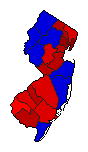
| Atlantic | Obama | 57.9% | |
| Romney | 41.0% | |
| Other | 1.1% | |
| Bergen | Obama | 55.1% | |
| Romney | 43.8% | |
| Other | 1.1% | |
| Burlington | Obama | 58.4% | |
| Romney | 40.4% | |
| Other | 1.2% | |
| Camden | Obama | 68.0% | |
| Romney | 30.7% | |
| Other | 1.2% | |
| Cape May | Obama | 45.0% | |
| Romney | 53.6% | |
| Other | 1.4% | |
| Cumberland | Obama | 61.5% | |
| Romney | 37.3% | |
| Other | 1.2% | |
| Essex | Obama | 78.0% | |
| Romney | 21.3% | |
| Other | 0.7% | |
| Gloucester | Obama | 54.6% | |
| Romney | 43.9% | |
| Other | 1.5% | |
| Hudson | Obama | 77.4% | |
| Romney | 21.4% | |
| Other | 1.1% | |
| Hunterdon | Obama | 40.3% | |
| Romney | 58.1% | |
| Other | 1.6% | |
| Mercer | Obama | 67.2% | |
| Romney | 30.5% | |
| Other | 2.3% | |
| Middlesex | Obama | 63.1% | |
| Romney | 35.5% | |
| Other | 1.3% | |
| Monmouth | Obama | 46.8% | |
| Romney | 51.8% | |
| Other | 1.3% | |
| Morris | Obama | 44.0% | |
| Romney | 54.8% | |
| Other | 1.2% | |
| Ocean | Obama | 40.6% | |
| Romney | 58.2% | |
| Other | 1.2% | |
| Passaic | Obama | 63.6% | |
| Romney | 35.4% | |
| Other | 1.0% | |
| Salem | Obama | 49.7% | |
| Romney | 48.4% | |
| Other | 1.9% | |
| Somerset | Obama | 52.1% | |
| Romney | 46.5% | |
| Other | 1.4% | |
| Sussex | Obama | 38.3% | |
| Romney | 59.6% | |
| Other | 2.1% | |
| Union | Obama | 66.5% | |
| Romney | 32.5% | |
| Other | 1.0% | |
| Warren | Obama | 41.3% | |
| Romney | 56.7% | |
| Other | 2.0% | |