1996 Lt. Gubernatorial General Election Data Graphs - North Carolina
by CountyData for this Contest was Contributed by on 2007-04-15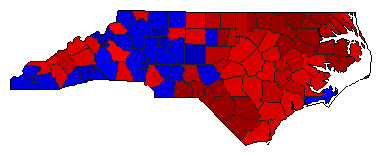
| Alamance | Wicker | 48.3% | |
| Arnold | 50.6% | |
| Other | 1.1% | |
| Alexander | Wicker | 43.0% | |
| Arnold | 56.3% | |
| Other | 0.6% | |
| Alleghany | Wicker | 54.2% | |
| Arnold | 45.0% | |
| Other | 0.8% | |
| Anson | Wicker | 78.0% | |
| Arnold | 21.3% | |
| Other | 0.7% | |
| Ashe | Wicker | 45.5% | |
| Arnold | 53.5% | |
| Other | 1.0% | |
| Avery | Wicker | 30.0% | |
| Arnold | 69.0% | |
| Other | 1.0% | |
| Beaufort | Wicker | 56.2% | |
| Arnold | 43.2% | |
| Other | 0.6% | |
| Bertie | Wicker | 78.6% | |
| Arnold | 21.1% | |
| Other | 0.3% | |
| Bladen | Wicker | 71.1% | |
| Arnold | 28.3% | |
| Other | 0.6% | |
| Brunswick | Wicker | 55.3% | |
| Arnold | 43.5% | |
| Other | 1.2% | |
| Buncombe | Wicker | 54.8% | |
| Arnold | 43.9% | |
| Other | 1.3% | |
| Burke | Wicker | 49.6% | |
| Arnold | 48.9% | |
| Other | 1.5% | |
| Cabarrus | Wicker | 44.7% | |
| Arnold | 53.9% | |
| Other | 1.4% | |
| Caldwell | Wicker | 45.2% | |
| Arnold | 53.8% | |
| Other | 1.0% | |
| Camden | Wicker | 61.0% | |
| Arnold | 37.5% | |
| Other | 1.5% | |
| Carteret | Wicker | 49.3% | |
| Arnold | 49.5% | |
| Other | 1.3% | |
| Caswell | Wicker | 68.5% | |
| Arnold | 31.3% | |
| Other | 0.3% | |
| Catawba | Wicker | 42.7% | |
| Arnold | 56.3% | |
| Other | 1.0% | |
| Chatham | Wicker | 62.7% | |
| Arnold | 36.0% | |
| Other | 1.3% | |
| Cherokee | Wicker | 46.2% | |
| Arnold | 53.2% | |
| Other | 0.6% | |
| Chowan | Wicker | 65.6% | |
| Arnold | 33.9% | |
| Other | 0.6% | |
| Clay | Wicker | 48.6% | |
| Arnold | 50.9% | |
| Other | 0.5% | |
| Cleveland | Wicker | 58.6% | |
| Arnold | 40.6% | |
| Other | 0.9% | |
| Columbus | Wicker | 72.7% | |
| Arnold | 26.6% | |
| Other | 0.7% | |
| Craven | Wicker | 53.4% | |
| Arnold | 46.0% | |
| Other | 0.6% | |
| Cumberland | Wicker | 59.6% | |
| Arnold | 39.4% | |
| Other | 1.0% | |
| Currituck | Wicker | 51.9% | |
| Arnold | 45.9% | |
| Other | 2.2% | |
| Dare | Wicker | 54.8% | |
| Arnold | 43.6% | |
| Other | 1.6% | |
| Davidson | Wicker | 39.6% | |
| Arnold | 59.4% | |
| Other | 1.1% | |
| Davie | Wicker | 37.0% | |
| Arnold | 62.6% | |
| Other | 0.5% | |
| Duplin | Wicker | 65.4% | |
| Arnold | 34.1% | |
| Other | 0.6% | |
| Durham | Wicker | 69.7% | |
| Arnold | 29.4% | |
| Other | 0.9% | |
| Edgecombe | Wicker | 72.8% | |
| Arnold | 26.7% | |
| Other | 0.5% | |
| Forsyth | Wicker | 50.6% | |
| Arnold | 48.3% | |
| Other | 1.1% | |
| Franklin | Wicker | 64.3% | |
| Arnold | 34.9% | |
| Other | 0.8% | |
| Gaston | Wicker | 46.6% | |
| Arnold | 52.4% | |
| Other | 1.0% | |
| Gates | Wicker | 75.5% | |
| Arnold | 24.3% | |
| Other | 0.2% | |
| Graham | Wicker | 43.9% | |
| Arnold | 55.9% | |
| Other | 0.2% | |
| Granville | Wicker | 67.6% | |
| Arnold | 31.7% | |
| Other | 0.7% | |
| Greene | Wicker | 63.7% | |
| Arnold | 35.9% | |
| Other | 0.4% | |
| Guilford | Wicker | 53.2% | |
| Arnold | 45.9% | |
| Other | 1.0% | |
| Halifax | Wicker | 71.6% | |
| Arnold | 28.0% | |
| Other | 0.4% | |
| Harnett | Wicker | 57.8% | |
| Arnold | 41.5% | |
| Other | 0.7% | |
| Haywood | Wicker | 61.2% | |
| Arnold | 37.7% | |
| Other | 1.2% | |
| Henderson | Wicker | 38.6% | |
| Arnold | 60.7% | |
| Other | 0.6% | |
| Hertford | Wicker | 76.8% | |
| Arnold | 22.7% | |
| Other | 0.6% | |
| Hoke | Wicker | 71.4% | |
| Arnold | 27.8% | |
| Other | 0.8% | |
| Hyde | Wicker | 71.4% | |
| Arnold | 28.2% | |
| Other | 0.5% | |
| Iredell | Wicker | 44.5% | |
| Arnold | 54.4% | |
| Other | 1.1% | |
| Jackson | Wicker | 57.1% | |
| Arnold | 42.1% | |
| Other | 0.8% | |
| Johnston | Wicker | 51.5% | |
| Arnold | 47.7% | |
| Other | 0.7% | |
| Jones | Wicker | 66.4% | |
| Arnold | 33.0% | |
| Other | 0.7% | |
| Lee | Wicker | 68.5% | |
| Arnold | 30.9% | |
| Other | 0.5% | |
| Lenoir | Wicker | 61.7% | |
| Arnold | 38.0% | |
| Other | 0.2% | |
| Lincoln | Wicker | 46.4% | |
| Arnold | 52.6% | |
| Other | 1.0% | |
| McDowell | Wicker | 48.8% | |
| Arnold | 49.9% | |
| Other | 1.3% | |
| Macon | Wicker | 46.8% | |
| Arnold | 52.3% | |
| Other | 0.9% | |
| Madison | Wicker | 56.3% | |
| Arnold | 43.2% | |
| Other | 0.6% | |
| Martin | Wicker | 74.2% | |
| Arnold | 25.4% | |
| Other | 0.4% | |
| Mecklenburg | Wicker | 54.8% | |
| Arnold | 44.1% | |
| Other | 1.2% | |
| Mitchell | Wicker | 30.4% | |
| Arnold | 68.4% | |
| Other | 1.2% | |
| Montgomery | Wicker | 60.7% | |
| Arnold | 38.5% | |
| Other | 0.8% | |
| Moore | Wicker | 46.0% | |
| Arnold | 53.5% | |
| Other | 0.5% | |
| Nash | Wicker | 52.7% | |
| Arnold | 46.8% | |
| Other | 0.6% | |
| New Hanover | Wicker | 51.2% | |
| Arnold | 47.3% | |
| Other | 1.5% | |
| Northampton | Wicker | 80.4% | |
| Arnold | 19.0% | |
| Other | 0.6% | |
| Onslow | Wicker | 51.5% | |
| Arnold | 46.9% | |
| Other | 1.6% | |
| Orange | Wicker | 70.2% | |
| Arnold | 28.3% | |
| Other | 1.5% | |
| Pamlico | Wicker | 59.1% | |
| Arnold | 40.1% | |
| Other | 0.9% | |
| Pasquotank | Wicker | 64.4% | |
| Arnold | 34.9% | |
| Other | 0.7% | |
| Pender | Wicker | 56.8% | |
| Arnold | 41.9% | |
| Other | 1.3% | |
| Perquimans | Wicker | 67.4% | |
| Arnold | 32.2% | |
| Other | 0.5% | |
| Person | Wicker | 62.9% | |
| Arnold | 36.5% | |
| Other | 0.6% | |
| Pitt | Wicker | 61.2% | |
| Arnold | 38.3% | |
| Other | 0.5% | |
| Polk | Wicker | 46.6% | |
| Arnold | 52.0% | |
| Other | 1.3% | |
| Randolph | Wicker | 37.0% | |
| Arnold | 62.1% | |
| Other | 0.9% | |
| Richmond | Wicker | 71.5% | |
| Arnold | 27.3% | |
| Other | 1.1% | |
| Robeson | Wicker | 77.7% | |
| Arnold | 21.4% | |
| Other | 0.9% | |
| Rockingham | Wicker | 52.5% | |
| Arnold | 46.6% | |
| Other | 0.8% | |
| Rowan | Wicker | 44.5% | |
| Arnold | 53.8% | |
| Other | 1.7% | |
| Rutherford | Wicker | 49.2% | |
| Arnold | 49.7% | |
| Other | 1.1% | |
| Sampson | Wicker | 57.7% | |
| Arnold | 41.8% | |
| Other | 0.5% | |
| Scotland | Wicker | 70.2% | |
| Arnold | 29.0% | |
| Other | 0.8% | |
| Stanly | Wicker | 45.1% | |
| Arnold | 53.8% | |
| Other | 1.2% | |
| Stokes | Wicker | 41.6% | |
| Arnold | 57.7% | |
| Other | 0.8% | |
| Surry | Wicker | 47.6% | |
| Arnold | 52.1% | |
| Other | 0.3% | |
| Swain | Wicker | 56.3% | |
| Arnold | 42.9% | |
| Other | 0.7% | |
| Transylvania | Wicker | 46.7% | |
| Arnold | 51.5% | |
| Other | 1.8% | |
| Tyrrell | Wicker | 75.9% | |
| Arnold | 24.1% | |
| Other | 0.1% | |
| Union | Wicker | 45.2% | |
| Arnold | 54.2% | |
| Other | 0.6% | |
| Vance | Wicker | 70.7% | |
| Arnold | 28.6% | |
| Other | 0.6% | |
| Wake | Wicker | 58.2% | |
| Arnold | 40.9% | |
| Other | 0.9% | |
| Warren | Wicker | 75.1% | |
| Arnold | 24.5% | |
| Other | 0.5% | |
| Washington | Wicker | 71.4% | |
| Arnold | 28.0% | |
| Other | 0.6% | |
| Watauga | Wicker | 49.0% | |
| Arnold | 48.0% | |
| Other | 3.0% | |
| Wayne | Wicker | 52.7% | |
| Arnold | 46.9% | |
| Other | 0.4% | |
| Wilkes | Wicker | 39.7% | |
| Arnold | 59.4% | |
| Other | 1.0% | |
| Wilson | Wicker | 59.9% | |
| Arnold | 39.8% | |
| Other | 0.3% | |
| Yadkin | Wicker | 34.9% | |
| Arnold | 64.5% | |
| Other | 0.6% | |
| Yancey | Wicker | 55.8% | |
| Arnold | 43.5% | |
| Other | 0.7% | |