2012 Gubernatorial General Election Data Graphs - North Carolina
Note: The Google advertisement links below may advocate political positions that this site does not endorse.
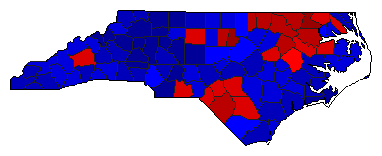
Map

AlamanceDalton38.2%
 
McCrory59.7%
 
0.0%
 
Other2.2%


AlexanderDalton21.9%
 
McCrory76.7%
 
0.0%
 
Other1.4%


AlleghanyDalton29.8%
 
McCrory67.7%
 
0.0%
 
Other2.5%


AnsonDalton58.6%
 
McCrory40.5%
 
0.0%
 
Other0.9%


AsheDalton28.9%
 
McCrory68.9%
 
0.0%
 
Other2.3%


AveryDalton19.0%
 
McCrory78.5%
 
0.0%
 
Other2.4%


BeaufortDalton38.3%
 
McCrory60.1%
 
0.0%
 
Other1.7%


BertieDalton65.6%
 
McCrory33.5%
 
0.0%
 
Other0.8%


BladenDalton51.2%
 
McCrory47.6%
 
0.0%
 
Other1.2%


BrunswickDalton32.8%
 
McCrory65.0%
 
0.0%
 
Other2.2%


BuncombeDalton51.0%
 
McCrory45.6%
 
0.0%
 
Other3.4%


BurkeDalton29.8%
 
McCrory68.4%
 
0.0%
 
Other1.9%


CabarrusDalton29.8%
 
McCrory68.3%
 
0.0%
 
Other1.9%


CaldwellDalton24.1%
 
McCrory73.8%
 
0.0%
 
Other2.1%


CamdenDalton34.5%
 
McCrory61.5%
 
0.0%
 
Other4.0%


CarteretDalton25.8%
 
McCrory72.3%
 
0.0%
 
Other1.9%


CaswellDalton47.4%
 
McCrory50.8%
 
0.0%
 
Other1.8%


CatawbaDalton26.5%
 
McCrory71.8%
 
0.0%
 
Other1.7%


ChathamDalton48.0%
 
McCrory49.7%
 
0.0%
 
Other2.2%


CherokeeDalton29.6%
 
McCrory65.8%
 
0.0%
 
Other4.7%


ChowanDalton48.3%
 
McCrory49.9%
 
0.0%
 
Other1.8%


ClayDalton29.7%
 
McCrory66.6%
 
0.0%
 
Other3.7%


ClevelandDalton37.6%
 
McCrory61.1%
 
0.0%
 
Other1.3%


ColumbusDalton49.0%
 
McCrory49.5%
 
0.0%
 
Other1.6%


CravenDalton37.4%
 
McCrory60.8%
 
0.0%
 
Other1.9%


CumberlandDalton56.2%
 
McCrory41.6%
 
0.0%
 
Other2.2%


CurrituckDalton30.3%
 
McCrory64.4%
 
0.0%
 
Other5.3%


DareDalton39.6%
 
McCrory56.5%
 
0.0%
 
Other4.0%


DavidsonDalton25.1%
 
McCrory72.8%
 
0.0%
 
Other2.1%


DavieDalton23.2%
 
McCrory74.9%
 
0.0%
 
Other1.9%


DuplinDalton43.3%
 
McCrory55.5%
 
0.0%
 
Other1.2%


DurhamDalton70.8%
 
McCrory26.6%
 
0.0%
 
Other2.6%


EdgecombeDalton66.8%
 
McCrory32.4%
 
0.0%
 
Other0.8%


ForsythDalton47.3%
 
McCrory50.6%
 
0.0%
 
Other2.1%


FranklinDalton43.4%
 
McCrory54.4%
 
0.0%
 
Other2.2%


GastonDalton29.8%
 
McCrory68.6%
 
0.0%
 
Other1.6%


GatesDalton53.8%
 
McCrory43.9%
 
0.0%
 
Other2.4%


GrahamDalton30.9%
 
McCrory66.6%
 
0.0%
 
Other2.5%


GranvilleDalton48.2%
 
McCrory49.9%
 
0.0%
 
Other1.9%


GreeneDalton45.6%
 
McCrory53.4%
 
0.0%
 
Other1.0%


GuilfordDalton52.1%
 
McCrory45.7%
 
0.0%
 
Other2.2%


HalifaxDalton64.9%
 
McCrory34.2%
 
0.0%
 
Other0.8%


HarnettDalton37.1%
 
McCrory60.8%
 
0.0%
 
Other2.1%


HaywoodDalton39.4%
 
McCrory57.9%
 
0.0%
 
Other2.7%


HendersonDalton32.1%
 
McCrory65.3%
 
0.0%
 
Other2.6%


HertfordDalton72.5%
 
McCrory26.4%
 
0.0%
 
Other1.1%


HokeDalton56.4%
 
McCrory41.2%
 
0.0%
 
Other2.3%


HydeDalton45.6%
 
McCrory52.3%
 
0.0%
 
Other2.2%


IredellDalton26.4%
 
McCrory71.9%
 
0.0%
 
Other1.7%


JacksonDalton45.4%
 
McCrory51.1%
 
0.0%
 
Other3.5%


JohnstonDalton32.3%
 
McCrory65.7%
 
0.0%
 
Other2.0%


JonesDalton42.6%
 
McCrory56.1%
 
0.0%
 
Other1.2%


LeeDalton41.9%
 
McCrory56.2%
 
0.0%
 
Other2.0%


LenoirDalton48.5%
 
McCrory50.4%
 
0.0%
 
Other1.1%


LincolnDalton22.4%
 
McCrory76.0%
 
0.0%
 
Other1.6%


McDowellDalton31.3%
 
McCrory66.2%
 
0.0%
 
Other2.6%


MaconDalton33.3%
 
McCrory63.8%
 
0.0%
 
Other2.9%


MadisonDalton42.0%
 
McCrory55.0%
 
0.0%
 
Other3.0%


MartinDalton52.5%
 
McCrory46.5%
 
0.0%
 
Other1.1%


MecklenburgDalton48.8%
 
McCrory49.5%
 
0.0%
 
Other1.8%


MitchellDalton21.5%
 
McCrory76.1%
 
0.0%
 
Other2.4%


MontgomeryDalton38.5%
 
McCrory59.9%
 
0.0%
 
Other1.6%


MooreDalton32.2%
 
McCrory66.2%
 
0.0%
 
Other1.6%


NashDalton48.4%
 
McCrory50.6%
 
0.0%
 
Other1.0%


New HanoverDalton40.9%
 
McCrory56.0%
 
0.0%
 
Other3.1%


NorthamptonDalton66.4%
 
McCrory32.5%
 
0.0%
 
Other1.1%


OnslowDalton32.6%
 
McCrory64.6%
 
0.0%
 
Other2.8%


OrangeDalton64.4%
 
McCrory32.4%
 
0.0%
 
Other3.1%


PamlicoDalton36.6%
 
McCrory61.5%
 
0.0%
 
Other2.0%


PasquotankDalton56.9%
 
McCrory40.3%
 
0.0%
 
Other2.7%


PenderDalton35.8%
 
McCrory62.0%
 
0.0%
 
Other2.1%


PerquimansDalton42.7%
 
McCrory54.9%
 
0.0%
 
Other2.5%


PersonDalton41.4%
 
McCrory56.7%
 
0.0%
 
Other1.9%


PittDalton49.7%
 
McCrory48.5%
 
0.0%
 
Other1.8%


PolkDalton38.5%
 
McCrory59.1%
 
0.0%
 
Other2.4%


RandolphDalton21.3%
 
McCrory76.8%
 
0.0%
 
Other1.9%


RichmondDalton47.4%
 
McCrory50.9%
 
0.0%
 
Other1.8%


RobesonDalton60.1%
 
McCrory38.0%
 
0.0%
 
Other1.8%


RockinghamDalton36.1%
 
McCrory62.0%
 
0.0%
 
Other1.9%


RowanDalton29.1%
 
McCrory69.2%
 
0.0%
 
Other1.6%


RutherfordDalton42.5%
 
McCrory55.8%
 
0.0%
 
Other1.7%


SampsonDalton43.4%
 
McCrory55.5%
 
0.0%
 
Other1.1%


ScotlandDalton57.7%
 
McCrory40.1%
 
0.0%
 
Other2.2%


StanlyDalton23.5%
 
McCrory75.1%
 
0.0%
 
Other1.4%


StokesDalton25.5%
 
McCrory72.1%
 
0.0%
 
Other2.4%


SurryDalton27.2%
 
McCrory70.7%
 
0.0%
 
Other2.1%


SwainDalton44.5%
 
McCrory51.9%
 
0.0%
 
Other3.6%


TransylvaniaDalton37.5%
 
McCrory59.7%
 
0.0%
 
Other2.8%


TyrrellDalton46.1%
 
McCrory52.2%
 
0.0%
 
Other1.7%


UnionDalton25.9%
 
McCrory72.4%
 
0.0%
 
Other1.7%


VanceDalton62.1%
 
McCrory36.9%
 
0.0%
 
Other1.0%


WakeDalton48.5%
 
McCrory48.7%
 
0.0%
 
Other2.8%


WarrenDalton66.0%
 
McCrory33.0%
 
0.0%
 
Other1.0%


WashingtonDalton59.0%
 
McCrory40.0%
 
0.0%
 
Other1.0%


WataugaDalton40.4%
 
McCrory55.0%
 
0.0%
 
Other4.6%


WayneDalton43.3%
 
McCrory55.3%
 
0.0%
 
Other1.4%


WilkesDalton24.2%
 
McCrory73.7%
 
0.0%
 
Other2.0%


WilsonDalton51.7%
 
McCrory47.1%
 
0.0%
 
Other1.1%


YadkinDalton19.9%
 
McCrory78.0%
 
0.0%
 
Other2.1%


YanceyDalton43.2%
 
McCrory54.9%
 
0.0%
 
Other1.9%


National DataGraph for 2012 - North Carolina Results for 2012

Login

Terms of Use - DCMA Policy - Privacy Policy and Cookies


© Dave Leip's Atlas of U.S. Elections, LLC 2019 All Rights Reserved