1976 Presidential General Election Data Graphs - North Dakota
by County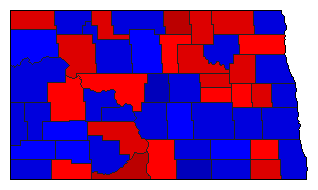
| Adams | Carter | 49.5% | |
| Ford | 48.5% | |
| Other | 2.0% | |
| Barnes | Carter | 44.5% | |
| Ford | 53.8% | |
| Other | 1.7% | |
| Benson | Carter | 53.0% | |
| Ford | 45.3% | |
| Other | 1.7% | |
| Billings | Carter | 41.7% | |
| Ford | 51.3% | |
| Other | 7.0% | |
| Bottineau | Carter | 42.3% | |
| Ford | 56.1% | |
| Other | 1.6% | |
| Bowman | Carter | 45.6% | |
| Ford | 51.7% | |
| Other | 2.7% | |
| Burke | Carter | 43.0% | |
| Ford | 52.0% | |
| Other | 4.9% | |
| Burleigh | Carter | 39.0% | |
| Ford | 58.1% | |
| Other | 2.9% | |
| Cass | Carter | 43.2% | |
| Ford | 54.5% | |
| Other | 2.3% | |
| Cavalier | Carter | 50.7% | |
| Ford | 47.6% | |
| Other | 1.8% | |
| Dickey | Carter | 43.5% | |
| Ford | 54.7% | |
| Other | 1.9% | |
| Divide | Carter | 53.4% | |
| Ford | 44.5% | |
| Other | 2.0% | |
| Dunn | Carter | 48.7% | |
| Ford | 48.3% | |
| Other | 3.0% | |
| Eddy | Carter | 54.7% | |
| Ford | 43.3% | |
| Other | 2.0% | |
| Emmons | Carter | 48.9% | |
| Ford | 45.9% | |
| Other | 5.2% | |
| Foster | Carter | 49.8% | |
| Ford | 48.6% | |
| Other | 1.6% | |
| Golden Valley | Carter | 39.7% | |
| Ford | 52.4% | |
| Other | 7.9% | |
| Grand Forks | Carter | 44.0% | |
| Ford | 52.7% | |
| Other | 3.3% | |
| Grant | Carter | 42.2% | |
| Ford | 53.4% | |
| Other | 4.5% | |
| Griggs | Carter | 49.6% | |
| Ford | 48.0% | |
| Other | 2.4% | |
| Hettinger | Carter | 47.6% | |
| Ford | 49.3% | |
| Other | 3.1% | |
| Kidder | Carter | 46.3% | |
| Ford | 47.2% | |
| Other | 6.6% | |
| LaMoure | Carter | 48.6% | |
| Ford | 49.0% | |
| Other | 2.4% | |
| Logan | Carter | 43.1% | |
| Ford | 50.3% | |
| Other | 6.6% | |
| McHenry | Carter | 48.5% | |
| Ford | 49.7% | |
| Other | 1.8% | |
| McIntosh | Carter | 32.9% | |
| Ford | 64.3% | |
| Other | 2.8% | |
| McKenzie | Carter | 44.8% | |
| Ford | 53.6% | |
| Other | 1.6% | |
| McLean | Carter | 49.7% | |
| Ford | 48.2% | |
| Other | 2.1% | |
| Mercer | Carter | 39.1% | |
| Ford | 59.8% | |
| Other | 1.1% | |
| Morton | Carter | 50.1% | |
| Ford | 47.0% | |
| Other | 2.9% | |
| Mountrail | Carter | 59.0% | |
| Ford | 38.6% | |
| Other | 2.4% | |
| Nelson | Carter | 53.4% | |
| Ford | 44.3% | |
| Other | 2.3% | |
| Oliver | Carter | 46.4% | |
| Ford | 50.4% | |
| Other | 3.2% | |
| Pembina | Carter | 43.7% | |
| Ford | 53.9% | |
| Other | 2.4% | |
| Pierce | Carter | 49.7% | |
| Ford | 48.4% | |
| Other | 2.0% | |
| Ramsey | Carter | 47.6% | |
| Ford | 50.6% | |
| Other | 1.7% | |
| Ransom | Carter | 49.6% | |
| Ford | 49.1% | |
| Other | 1.3% | |
| Renville | Carter | 54.6% | |
| Ford | 44.0% | |
| Other | 1.4% | |
| Richland | Carter | 46.9% | |
| Ford | 51.0% | |
| Other | 2.1% | |
| Rolette | Carter | 68.5% | |
| Ford | 29.6% | |
| Other | 1.8% | |
| Sargent | Carter | 54.2% | |
| Ford | 44.3% | |
| Other | 1.4% | |
| Sheridan | Carter | 37.0% | |
| Ford | 60.9% | |
| Other | 2.1% | |
| Sioux | Carter | 64.5% | |
| Ford | 32.7% | |
| Other | 2.8% | |
| Slope | Carter | 47.8% | |
| Ford | 48.9% | |
| Other | 3.3% | |
| Stark | Carter | 46.5% | |
| Ford | 49.9% | |
| Other | 3.5% | |
| Steele | Carter | 55.3% | |
| Ford | 43.4% | |
| Other | 1.3% | |
| Stutsman | Carter | 45.3% | |
| Ford | 52.4% | |
| Other | 2.3% | |
| Towner | Carter | 54.4% | |
| Ford | 44.4% | |
| Other | 1.1% | |
| Traill | Carter | 44.8% | |
| Ford | 53.3% | |
| Other | 1.9% | |
| Walsh | Carter | 48.6% | |
| Ford | 48.1% | |
| Other | 3.2% | |
| Ward | Carter | 41.7% | |
| Ford | 56.1% | |
| Other | 2.1% | |
| Wells | Carter | 46.2% | |
| Ford | 51.5% | |
| Other | 2.2% | |
| Williams | Carter | 48.2% | |
| Ford | 48.7% | |
| Other | 3.1% | |