1972 Presidential General Election Data Graphs - Ohio
Note: The Google advertisement links below may advocate political positions that this site does not endorse.
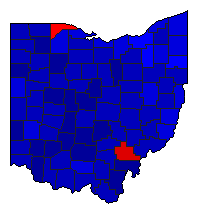
Map

AdamsMcGovern34.4%
 
Nixon63.2%
 
Other2.4%


AllenMcGovern26.4%
 
Nixon70.0%
 
Other3.6%


AshlandMcGovern25.2%
 
Nixon73.0%
 
Other1.8%


AshtabulaMcGovern39.0%
 
Nixon59.0%
 
Other2.1%


AthensMcGovern50.1%
 
Nixon48.9%
 
Other1.0%


AuglaizeMcGovern27.1%
 
Nixon69.8%
 
Other3.1%


BelmontMcGovern45.0%
 
Nixon53.6%
 
Other1.4%


BrownMcGovern34.9%
 
Nixon62.7%
 
Other2.4%


ButlerMcGovern28.8%
 
Nixon68.4%
 
Other2.8%


CarrollMcGovern30.6%
 
Nixon66.4%
 
Other3.1%


ChampaignMcGovern28.8%
 
Nixon69.5%
 
Other1.8%


ClarkMcGovern35.4%
 
Nixon61.8%
 
Other2.8%


ClermontMcGovern25.9%
 
Nixon71.7%
 
Other2.4%


ClintonMcGovern24.7%
 
Nixon74.1%
 
Other1.3%


ColumbianaMcGovern36.0%
 
Nixon62.6%
 
Other1.4%


CoshoctonMcGovern31.1%
 
Nixon66.2%
 
Other2.7%


CrawfordMcGovern26.2%
 
Nixon69.5%
 
Other4.3%


CuyahogaMcGovern48.1%
 
Nixon49.9%
 
Other1.9%


DarkeMcGovern31.0%
 
Nixon65.7%
 
Other3.3%


DefianceMcGovern32.1%
 
Nixon65.4%
 
Other2.5%


DelawareMcGovern24.9%
 
Nixon72.4%
 
Other2.7%


ErieMcGovern38.1%
 
Nixon58.5%
 
Other3.5%


FairfieldMcGovern25.3%
 
Nixon71.7%
 
Other3.0%


FayetteMcGovern24.6%
 
Nixon73.3%
 
Other2.1%


FranklinMcGovern34.1%
 
Nixon63.7%
 
Other2.2%


FultonMcGovern29.5%
 
Nixon68.6%
 
Other1.9%


GalliaMcGovern26.1%
 
Nixon72.4%
 
Other1.5%


GeaugaMcGovern31.1%
 
Nixon66.3%
 
Other2.6%


GreeneMcGovern32.7%
 
Nixon65.1%
 
Other2.1%


GuernseyMcGovern32.5%
 
Nixon66.0%
 
Other1.5%


HamiltonMcGovern32.7%
 
Nixon65.6%
 
Other1.7%


HancockMcGovern23.7%
 
Nixon70.7%
 
Other5.6%


HardinMcGovern28.1%
 
Nixon69.1%
 
Other2.8%


HarrisonMcGovern34.1%
 
Nixon65.0%
 
Other1.0%


HenryMcGovern27.4%
 
Nixon70.6%
 
Other2.0%


HighlandMcGovern28.3%
 
Nixon69.7%
 
Other1.9%


HockingMcGovern33.8%
 
Nixon63.7%
 
Other2.5%


HolmesMcGovern28.1%
 
Nixon70.0%
 
Other1.9%


HuronMcGovern31.7%
 
Nixon63.1%
 
Other5.2%


JacksonMcGovern31.2%
 
Nixon67.3%
 
Other1.5%


JeffersonMcGovern42.3%
 
Nixon56.3%
 
Other1.4%


KnoxMcGovern32.1%
 
Nixon64.0%
 
Other4.0%


LakeMcGovern38.2%
 
Nixon58.9%
 
Other3.0%


LawrenceMcGovern31.5%
 
Nixon67.0%
 
Other1.5%


LickingMcGovern29.5%
 
Nixon66.5%
 
Other4.0%


LoganMcGovern24.6%
 
Nixon71.1%
 
Other4.3%


LorainMcGovern40.3%
 
Nixon56.1%
 
Other3.6%


LucasMcGovern49.3%
 
Nixon48.4%
 
Other2.3%


MadisonMcGovern22.5%
 
Nixon75.7%
 
Other1.9%


MahoningMcGovern48.4%
 
Nixon49.7%
 
Other1.9%


MarionMcGovern31.1%
 
Nixon67.0%
 
Other1.9%


MedinaMcGovern32.8%
 
Nixon64.8%
 
Other2.3%


MeigsMcGovern27.7%
 
Nixon70.7%
 
Other1.6%


MercerMcGovern38.9%
 
Nixon57.6%
 
Other3.5%


MiamiMcGovern29.4%
 
Nixon68.4%
 
Other2.1%


MonroeMcGovern39.5%
 
Nixon59.1%
 
Other1.4%


MontgomeryMcGovern39.4%
 
Nixon58.0%
 
Other2.6%


MorganMcGovern28.9%
 
Nixon68.5%
 
Other2.6%


MorrowMcGovern25.9%
 
Nixon70.6%
 
Other3.5%


MuskingumMcGovern33.2%
 
Nixon64.0%
 
Other2.8%


NobleMcGovern30.2%
 
Nixon68.2%
 
Other1.6%


OttawaMcGovern38.3%
 
Nixon57.9%
 
Other3.9%


PauldingMcGovern32.5%
 
Nixon64.8%
 
Other2.7%


PerryMcGovern34.5%
 
Nixon62.1%
 
Other3.4%


PickawayMcGovern22.9%
 
Nixon74.3%
 
Other2.8%


PikeMcGovern40.3%
 
Nixon57.5%
 
Other2.2%


PortageMcGovern46.2%
 
Nixon51.8%
 
Other2.1%


PrebleMcGovern27.1%
 
Nixon70.3%
 
Other2.6%


PutnamMcGovern30.2%
 
Nixon66.3%
 
Other3.5%


RichlandMcGovern29.5%
 
Nixon68.2%
 
Other2.3%


RossMcGovern26.9%
 
Nixon71.1%
 
Other2.0%


SanduskyMcGovern34.1%
 
Nixon63.6%
 
Other2.2%


SciotoMcGovern34.7%
 
Nixon63.1%
 
Other2.1%


SenecaMcGovern35.7%
 
Nixon60.8%
 
Other3.5%


ShelbyMcGovern32.1%
 
Nixon61.8%
 
Other6.1%


StarkMcGovern35.1%
 
Nixon62.7%
 
Other2.1%


SummitMcGovern48.2%
 
Nixon49.9%
 
Other1.9%


TrumbullMcGovern41.4%
 
Nixon55.9%
 
Other2.7%


TuscarawasMcGovern39.3%
 
Nixon59.1%
 
Other1.6%


UnionMcGovern22.1%
 
Nixon75.9%
 
Other2.0%


Van WertMcGovern27.2%
 
Nixon71.3%
 
Other1.5%


VintonMcGovern35.4%
 
Nixon62.8%
 
Other1.7%


WarrenMcGovern24.9%
 
Nixon72.4%
 
Other2.7%


WashingtonMcGovern28.5%
 
Nixon68.6%
 
Other2.9%


WayneMcGovern30.8%
 
Nixon67.7%
 
Other1.5%


WilliamsMcGovern31.4%
 
Nixon66.8%
 
Other1.8%


WoodMcGovern37.9%
 
Nixon59.2%
 
Other3.0%


WyandotMcGovern29.4%
 
Nixon68.1%
 
Other2.4%


National DataGraph for 1972 - Ohio Results for 1972

Login

Terms of Use - DCMA Policy - Privacy Policy and Cookies


© Dave Leip's Atlas of U.S. Elections, LLC 2019 All Rights Reserved