1996 Presidential General Election Data Graphs - Oklahoma
Note: The Google advertisement links below may advocate political positions that this site does not endorse.
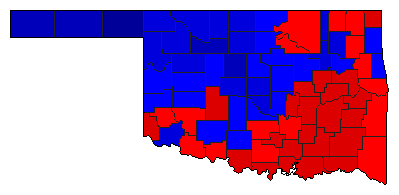
Map

AdairClinton42.8%
 
Dole45.3%
 
Perot11.5%
 
Other0.3%


AlfalfaClinton29.9%
 
Dole56.5%
 
Perot13.1%
 
Other0.6%


AtokaClinton52.2%
 
Dole35.3%
 
Perot12.2%
 
Other0.4%


BeaverClinton19.7%
 
Dole72.5%
 
Perot7.6%
 
Other0.2%


BeckhamClinton42.7%
 
Dole44.5%
 
Perot12.5%
 
Other0.4%


BlaineClinton40.4%
 
Dole46.9%
 
Perot12.4%
 
Other0.3%


BryanClinton52.6%
 
Dole34.8%
 
Perot12.3%
 
Other0.3%


CaddoClinton50.1%
 
Dole35.4%
 
Perot14.0%
 
Other0.5%


CanadianClinton29.4%
 
Dole59.4%
 
Perot10.8%
 
Other0.4%


CarterClinton44.2%
 
Dole42.8%
 
Perot12.6%
 
Other0.4%


CherokeeClinton49.8%
 
Dole36.8%
 
Perot13.0%
 
Other0.4%


ChoctawClinton59.5%
 
Dole29.4%
 
Perot10.9%
 
Other0.2%


CimarronClinton24.8%
 
Dole67.8%
 
Perot7.0%
 
Other0.4%


ClevelandClinton37.3%
 
Dole52.2%
 
Perot9.7%
 
Other0.7%


CoalClinton52.9%
 
Dole32.2%
 
Perot14.2%
 
Other0.6%


ComancheClinton42.4%
 
Dole47.8%
 
Perot9.3%
 
Other0.5%


CottonClinton46.6%
 
Dole38.6%
 
Perot14.1%
 
Other0.6%


CraigClinton48.3%
 
Dole37.5%
 
Perot13.8%
 
Other0.4%


CreekClinton43.1%
 
Dole43.9%
 
Perot12.6%
 
Other0.4%


CusterClinton40.8%
 
Dole47.8%
 
Perot11.1%
 
Other0.3%


DelawareClinton42.7%
 
Dole43.8%
 
Perot13.2%
 
Other0.4%


DeweyClinton35.5%
 
Dole51.2%
 
Perot12.7%
 
Other0.6%


EllisClinton31.0%
 
Dole54.6%
 
Perot14.0%
 
Other0.4%


GarfieldClinton34.4%
 
Dole53.6%
 
Perot11.6%
 
Other0.5%


GarvinClinton47.5%
 
Dole38.3%
 
Perot13.8%
 
Other0.4%


GradyClinton40.1%
 
Dole46.3%
 
Perot13.1%
 
Other0.4%


GrantClinton32.7%
 
Dole52.1%
 
Perot14.5%
 
Other0.8%


GreerClinton49.3%
 
Dole36.0%
 
Perot14.3%
 
Other0.4%


HarmonClinton54.9%
 
Dole33.8%
 
Perot10.8%
 
Other0.5%


HarperClinton28.7%
 
Dole58.3%
 
Perot12.3%
 
Other0.7%


HaskellClinton57.5%
 
Dole30.0%
 
Perot12.3%
 
Other0.2%


HughesClinton54.8%
 
Dole30.1%
 
Perot14.6%
 
Other0.5%


JacksonClinton37.8%
 
Dole51.5%
 
Perot10.4%
 
Other0.3%


JeffersonClinton54.0%
 
Dole32.7%
 
Perot12.7%
 
Other0.5%


JohnstonClinton53.0%
 
Dole32.6%
 
Perot14.1%
 
Other0.2%


KayClinton35.3%
 
Dole49.9%
 
Perot14.3%
 
Other0.5%


KingfisherClinton28.6%
 
Dole60.3%
 
Perot10.9%
 
Other0.2%


KiowaClinton47.8%
 
Dole39.7%
 
Perot12.4%
 
Other0.2%


LatimerClinton55.5%
 
Dole29.7%
 
Perot14.4%
 
Other0.3%


Le FloreClinton47.7%
 
Dole39.7%
 
Perot12.0%
 
Other0.5%


LincolnClinton38.9%
 
Dole47.1%
 
Perot13.5%
 
Other0.4%


LoganClinton39.5%
 
Dole48.5%
 
Perot11.5%
 
Other0.5%


LoveClinton50.7%
 
Dole37.0%
 
Perot11.7%
 
Other0.6%


McClainClinton39.8%
 
Dole46.2%
 
Perot13.7%
 
Other0.4%


McCurtainClinton44.5%
 
Dole39.8%
 
Perot15.2%
 
Other0.5%


McIntoshClinton54.9%
 
Dole31.2%
 
Perot13.6%
 
Other0.4%


MajorClinton25.6%
 
Dole62.3%
 
Perot11.7%
 
Other0.4%


MarshallClinton53.4%
 
Dole32.7%
 
Perot13.5%
 
Other0.4%


MayesClinton47.9%
 
Dole39.6%
 
Perot12.2%
 
Other0.3%


MurrayClinton51.7%
 
Dole33.8%
 
Perot14.3%
 
Other0.3%


MuskogeeClinton51.5%
 
Dole35.6%
 
Perot12.6%
 
Other0.3%


NobleClinton36.7%
 
Dole48.4%
 
Perot14.5%
 
Other0.5%


NowataClinton46.4%
 
Dole37.8%
 
Perot15.2%
 
Other0.6%


OkfuskeeClinton51.7%
 
Dole34.4%
 
Perot13.4%
 
Other0.5%


OklahomaClinton36.5%
 
Dole54.7%
 
Perot8.4%
 
Other0.4%


OkmulgeeClinton56.6%
 
Dole31.8%
 
Perot11.1%
 
Other0.4%


OsageClinton48.4%
 
Dole38.4%
 
Perot12.8%
 
Other0.5%


OttawaClinton50.8%
 
Dole35.9%
 
Perot13.0%
 
Other0.3%


PawneeClinton44.3%
 
Dole42.6%
 
Perot12.6%
 
Other0.4%


PayneClinton41.1%
 
Dole48.1%
 
Perot10.2%
 
Other0.7%


PittsburgClinton50.5%
 
Dole35.6%
 
Perot13.2%
 
Other0.6%


PontotocClinton47.5%
 
Dole39.4%
 
Perot12.6%
 
Other0.5%


PottawatomieClinton42.0%
 
Dole45.1%
 
Perot12.5%
 
Other0.4%


PushmatahaClinton52.3%
 
Dole33.6%
 
Perot13.5%
 
Other0.6%


Roger MillsClinton37.9%
 
Dole49.6%
 
Perot12.1%
 
Other0.4%


RogersClinton37.3%
 
Dole50.4%
 
Perot11.8%
 
Other0.4%


SeminoleClinton51.3%
 
Dole35.7%
 
Perot12.7%
 
Other0.3%


SequoyahClinton46.7%
 
Dole39.0%
 
Perot13.8%
 
Other0.4%


StephensClinton40.8%
 
Dole45.8%
 
Perot13.0%
 
Other0.4%


TexasClinton23.1%
 
Dole68.0%
 
Perot8.5%
 
Other0.4%


TillmanClinton49.9%
 
Dole36.8%
 
Perot12.9%
 
Other0.4%


TulsaClinton37.1%
 
Dole53.6%
 
Perot8.8%
 
Other0.5%


WagonerClinton39.6%
 
Dole48.0%
 
Perot12.1%
 
Other0.3%


WashingtonClinton32.5%
 
Dole56.1%
 
Perot10.9%
 
Other0.5%


WashitaClinton40.9%
 
Dole42.7%
 
Perot16.0%
 
Other0.4%


WoodsClinton34.9%
 
Dole52.4%
 
Perot12.1%
 
Other0.6%


WoodwardClinton32.0%
 
Dole54.6%
 
Perot12.8%
 
Other0.5%


National DataGraph for 1996 - Oklahoma Results for 1996

Login

Terms of Use - DCMA Policy - Privacy Policy and Cookies


© Dave Leip's Atlas of U.S. Elections, LLC 2019 All Rights Reserved