2014 Gubernatorial General Election Data Graphs - Oklahoma
Note: The Google advertisement links below may advocate political positions that this site does not endorse.
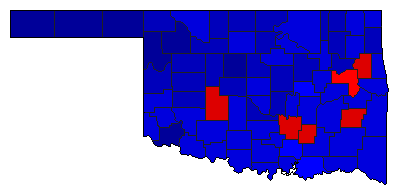
Map

AdairDorman41.9%
 
Fallin53.9%
 
Willis3.0%
 
Other1.2%


AlfalfaDorman34.2%
 
Fallin62.8%
 
Willis2.3%
 
Other0.7%


AtokaDorman43.8%
 
Fallin52.3%
 
Willis2.9%
 
Other1.0%


BeaverDorman22.6%
 
Fallin73.2%
 
Willis2.2%
 
Other1.9%


BeckhamDorman36.6%
 
Fallin59.9%
 
Willis2.6%
 
Other0.9%


BlaineDorman36.7%
 
Fallin60.1%
 
Willis2.5%
 
Other0.7%


BryanDorman47.1%
 
Fallin49.5%
 
Willis2.2%
 
Other1.2%


CaddoDorman53.0%
 
Fallin45.1%
 
Willis1.4%
 
Other0.5%


CanadianDorman31.1%
 
Fallin65.9%
 
Willis1.9%
 
Other1.1%


CarterDorman39.5%
 
Fallin55.9%
 
Willis3.2%
 
Other1.4%


CherokeeDorman51.2%
 
Fallin45.1%
 
Willis2.5%
 
Other1.2%


ChoctawDorman41.0%
 
Fallin55.7%
 
Willis2.1%
 
Other1.2%


CimarronDorman17.9%
 
Fallin75.3%
 
Willis3.8%
 
Other3.0%


ClevelandDorman45.2%
 
Fallin51.5%
 
Willis2.2%
 
Other1.2%


CoalDorman53.5%
 
Fallin42.8%
 
Willis2.1%
 
Other1.7%


ComancheDorman46.5%
 
Fallin50.5%
 
Willis2.0%
 
Other1.1%


CottonDorman43.3%
 
Fallin53.6%
 
Willis1.7%
 
Other1.4%


CraigDorman41.8%
 
Fallin54.9%
 
Willis2.2%
 
Other1.1%


CreekDorman34.0%
 
Fallin62.7%
 
Willis2.1%
 
Other1.2%


CusterDorman32.6%
 
Fallin64.6%
 
Willis1.9%
 
Other0.9%


DelawareDorman34.8%
 
Fallin62.4%
 
Willis1.7%
 
Other1.1%


DeweyDorman30.3%
 
Fallin66.6%
 
Willis1.7%
 
Other1.4%


EllisDorman25.3%
 
Fallin71.2%
 
Willis1.9%
 
Other1.5%


GarfieldDorman38.7%
 
Fallin57.1%
 
Willis2.6%
 
Other1.6%


GarvinDorman40.2%
 
Fallin56.6%
 
Willis2.2%
 
Other0.9%


GradyDorman43.1%
 
Fallin54.4%
 
Willis1.6%
 
Other0.9%


GrantDorman34.9%
 
Fallin61.3%
 
Willis2.9%
 
Other0.9%


GreerDorman41.4%
 
Fallin55.1%
 
Willis2.1%
 
Other1.4%


HarmonDorman39.2%
 
Fallin58.9%
 
Willis0.9%
 
Other1.0%


HarperDorman26.8%
 
Fallin69.6%
 
Willis2.6%
 
Other0.9%


HaskellDorman47.3%
 
Fallin50.4%
 
Willis1.7%
 
Other0.6%


HughesDorman43.2%
 
Fallin53.2%
 
Willis2.1%
 
Other1.5%


JacksonDorman24.2%
 
Fallin73.0%
 
Willis1.8%
 
Other1.0%


JeffersonDorman44.8%
 
Fallin51.6%
 
Willis2.6%
 
Other1.0%


JohnstonDorman47.5%
 
Fallin48.1%
 
Willis3.0%
 
Other1.4%


KayDorman35.5%
 
Fallin61.4%
 
Willis2.0%
 
Other1.1%


KingfisherDorman25.6%
 
Fallin71.8%
 
Willis1.6%
 
Other0.9%


KiowaDorman44.3%
 
Fallin53.1%
 
Willis1.6%
 
Other0.9%


LatimerDorman53.6%
 
Fallin43.1%
 
Willis2.0%
 
Other1.3%


Le FloreDorman41.5%
 
Fallin53.8%
 
Willis3.2%
 
Other1.5%


LincolnDorman34.4%
 
Fallin61.7%
 
Willis2.5%
 
Other1.4%


LoganDorman32.4%
 
Fallin64.2%
 
Willis2.1%
 
Other1.3%


LoveDorman40.8%
 
Fallin54.8%
 
Willis3.2%
 
Other1.2%


McClainDorman35.4%
 
Fallin61.7%
 
Willis1.7%
 
Other1.2%


McCurtainDorman43.4%
 
Fallin51.2%
 
Willis3.7%
 
Other1.6%


McIntoshDorman45.5%
 
Fallin51.2%
 
Willis2.3%
 
Other0.9%


MajorDorman31.5%
 
Fallin64.4%
 
Willis3.0%
 
Other1.0%


MarshallDorman43.7%
 
Fallin52.4%
 
Willis2.6%
 
Other1.3%


MayesDorman42.2%
 
Fallin54.2%
 
Willis2.4%
 
Other1.2%


MurrayDorman42.4%
 
Fallin54.4%
 
Willis2.0%
 
Other1.2%


MuskogeeDorman49.1%
 
Fallin47.6%
 
Willis2.2%
 
Other1.0%


NobleDorman31.8%
 
Fallin65.1%
 
Willis2.0%
 
Other1.1%


NowataDorman35.2%
 
Fallin61.2%
 
Willis2.2%
 
Other1.3%


OkfuskeeDorman47.6%
 
Fallin49.0%
 
Willis2.4%
 
Other1.1%


OklahomaDorman45.9%
 
Fallin51.3%
 
Willis1.8%
 
Other1.0%


OkmulgeeDorman46.1%
 
Fallin50.8%
 
Willis2.0%
 
Other1.1%


OsageDorman44.5%
 
Fallin52.1%
 
Willis2.5%
 
Other0.9%


OttawaDorman39.6%
 
Fallin56.5%
 
Willis2.6%
 
Other1.3%


PawneeDorman36.6%
 
Fallin59.7%
 
Willis2.3%
 
Other1.4%


PayneDorman45.8%
 
Fallin51.4%
 
Willis1.8%
 
Other1.0%


PittsburgDorman45.2%
 
Fallin50.8%
 
Willis2.7%
 
Other1.3%


PontotocDorman50.8%
 
Fallin46.0%
 
Willis2.2%
 
Other1.0%


PottawatomieDorman35.8%
 
Fallin60.9%
 
Willis2.1%
 
Other1.2%


PushmatahaDorman44.1%
 
Fallin51.2%
 
Willis2.8%
 
Other1.8%


Roger MillsDorman33.6%
 
Fallin63.8%
 
Willis1.8%
 
Other0.8%


RogersDorman32.7%
 
Fallin64.0%
 
Willis2.1%
 
Other1.2%


SeminoleDorman41.0%
 
Fallin55.8%
 
Willis2.0%
 
Other1.2%


SequoyahDorman42.2%
 
Fallin54.1%
 
Willis2.2%
 
Other1.4%


StephensDorman40.6%
 
Fallin56.2%
 
Willis2.2%
 
Other1.0%


TexasDorman19.8%
 
Fallin76.4%
 
Willis2.5%
 
Other1.3%


TillmanDorman38.0%
 
Fallin58.5%
 
Willis2.0%
 
Other1.4%


TulsaDorman40.3%
 
Fallin56.9%
 
Willis1.8%
 
Other1.0%


WagonerDorman32.9%
 
Fallin63.8%
 
Willis2.4%
 
Other1.0%


WashingtonDorman29.6%
 
Fallin66.5%
 
Willis2.6%
 
Other1.4%


WashitaDorman33.9%
 
Fallin63.4%
 
Willis1.8%
 
Other0.9%


WoodsDorman37.3%
 
Fallin58.7%
 
Willis2.2%
 
Other1.8%


WoodwardDorman26.3%
 
Fallin70.8%
 
Willis2.1%
 
Other0.9%


National DataGraph for 2014 - Oklahoma Results for 2014

Login

Terms of Use - DCMA Policy - Privacy Policy and Cookies


© Dave Leip's Atlas of U.S. Elections, LLC 2019 All Rights Reserved