2002 Gubernatorial General Election Data Graphs - South Dakota
Note: The Google advertisement links below may advocate political positions that this site does not endorse.
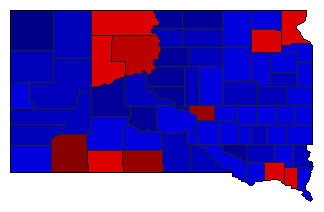
Map

AuroraAbbott48.6%
 
Rounds50.2%
 
0.0%
 
Other1.2%


BeadleAbbott37.3%
 
Rounds61.8%
 
0.0%
 
Other0.9%


BennettAbbott52.4%
 
Rounds44.5%
 
0.0%
 
Other3.1%


Bon HommeAbbott46.9%
 
Rounds51.7%
 
0.0%
 
Other1.4%


BrookingsAbbott42.6%
 
Rounds56.2%
 
0.0%
 
Other1.2%


BrownAbbott44.0%
 
Rounds54.9%
 
0.0%
 
Other1.1%


BruleAbbott40.3%
 
Rounds59.1%
 
0.0%
 
Other0.6%


BuffaloAbbott75.3%
 
Rounds22.9%
 
0.0%
 
Other1.8%


ButteAbbott34.9%
 
Rounds63.2%
 
0.0%
 
Other1.9%


CampbellAbbott25.6%
 
Rounds73.3%
 
0.0%
 
Other1.1%


Charles MixAbbott44.2%
 
Rounds55.1%
 
0.0%
 
Other0.7%


ClarkAbbott39.7%
 
Rounds59.5%
 
0.0%
 
Other0.8%


ClayAbbott59.8%
 
Rounds38.4%
 
0.0%
 
Other1.7%


CodingtonAbbott41.5%
 
Rounds57.7%
 
0.0%
 
Other0.8%


CorsonAbbott53.6%
 
Rounds42.8%
 
0.0%
 
Other3.6%


CusterAbbott32.3%
 
Rounds65.1%
 
0.0%
 
Other2.6%


DavisonAbbott40.4%
 
Rounds58.5%
 
0.0%
 
Other1.0%


DayAbbott52.8%
 
Rounds46.2%
 
0.0%
 
Other0.9%


DeuelAbbott47.4%
 
Rounds51.3%
 
0.0%
 
Other1.3%


DeweyAbbott61.4%
 
Rounds36.1%
 
0.0%
 
Other2.4%


DouglasAbbott25.0%
 
Rounds74.2%
 
0.0%
 
Other0.8%


EdmundsAbbott34.4%
 
Rounds64.3%
 
0.0%
 
Other1.2%


Fall RiverAbbott36.6%
 
Rounds59.0%
 
0.0%
 
Other4.3%


FaulkAbbott32.6%
 
Rounds66.5%
 
0.0%
 
Other0.8%


GrantAbbott45.8%
 
Rounds52.5%
 
0.0%
 
Other1.7%


GregoryAbbott37.6%
 
Rounds61.5%
 
0.0%
 
Other0.9%


HaakonAbbott24.9%
 
Rounds74.1%
 
0.0%
 
Other1.0%


HamlinAbbott36.1%
 
Rounds62.7%
 
0.0%
 
Other1.2%


HandAbbott41.6%
 
Rounds57.6%
 
0.0%
 
Other0.8%


HansonAbbott33.3%
 
Rounds65.2%
 
0.0%
 
Other1.5%


HardingAbbott15.6%
 
Rounds83.1%
 
0.0%
 
Other1.3%


HughesAbbott26.2%
 
Rounds73.4%
 
0.0%
 
Other0.5%


HutchinsonAbbott34.6%
 
Rounds64.7%
 
0.0%
 
Other0.7%


HydeAbbott30.9%
 
Rounds68.3%
 
0.0%
 
Other0.8%


JacksonAbbott38.0%
 
Rounds59.0%
 
0.0%
 
Other3.0%


JerauldAbbott45.9%
 
Rounds51.8%
 
0.0%
 
Other2.3%


JonesAbbott24.1%
 
Rounds74.9%
 
0.0%
 
Other1.0%


KingsburyAbbott35.1%
 
Rounds63.6%
 
0.0%
 
Other1.3%


LakeAbbott46.1%
 
Rounds52.9%
 
0.0%
 
Other1.0%


LawrenceAbbott38.5%
 
Rounds59.3%
 
0.0%
 
Other2.2%


LincolnAbbott38.9%
 
Rounds60.3%
 
0.0%
 
Other0.7%


LymanAbbott42.9%
 
Rounds56.5%
 
0.0%
 
Other0.7%


McCookAbbott45.1%
 
Rounds53.9%
 
0.0%
 
Other1.0%


McPhersonAbbott21.9%
 
Rounds76.8%
 
0.0%
 
Other1.3%


MarshallAbbott49.0%
 
Rounds50.5%
 
0.0%
 
Other0.5%


MeadeAbbott33.8%
 
Rounds64.6%
 
0.0%
 
Other1.7%


MelletteAbbott41.9%
 
Rounds54.7%
 
0.0%
 
Other3.4%


MinerAbbott45.1%
 
Rounds53.7%
 
0.0%
 
Other1.2%


MinnehahaAbbott43.9%
 
Rounds55.1%
 
0.0%
 
Other1.1%


MoodyAbbott43.6%
 
Rounds55.2%
 
0.0%
 
Other1.2%


PenningtonAbbott38.1%
 
Rounds60.4%
 
0.0%
 
Other1.5%


PerkinsAbbott28.8%
 
Rounds67.7%
 
0.0%
 
Other3.4%


PotterAbbott28.4%
 
Rounds70.7%
 
0.0%
 
Other0.9%


RobertsAbbott54.5%
 
Rounds44.0%
 
0.0%
 
Other1.5%


SanbornAbbott47.6%
 
Rounds51.3%
 
0.0%
 
Other1.1%


ShannonAbbott86.0%
 
Rounds8.7%
 
0.0%
 
Other5.3%


SpinkAbbott42.9%
 
Rounds56.6%
 
0.0%
 
Other0.6%


StanleyAbbott33.9%
 
Rounds65.6%
 
0.0%
 
Other0.5%


SullyAbbott27.8%
 
Rounds71.5%
 
0.0%
 
Other0.7%


ToddAbbott75.6%
 
Rounds22.1%
 
0.0%
 
Other2.4%


TrippAbbott36.0%
 
Rounds63.2%
 
0.0%
 
Other0.8%


TurnerAbbott42.1%
 
Rounds56.9%
 
0.0%
 
Other0.9%


UnionAbbott44.9%
 
Rounds53.2%
 
0.0%
 
Other1.9%


WalworthAbbott32.5%
 
Rounds66.3%
 
0.0%
 
Other1.2%


YanktonAbbott51.7%
 
Rounds47.0%
 
0.0%
 
Other1.2%


ZiebachAbbott55.2%
 
Rounds41.5%
 
0.0%
 
Other3.3%


National DataGraph for 2002 - South Dakota Results for 2002

Login

Terms of Use - DCMA Policy - Privacy Policy and Cookies


© Dave Leip's Atlas of U.S. Elections, LLC 2019 All Rights Reserved