2018 Representative General Election Data Graphs - South Dakota
by County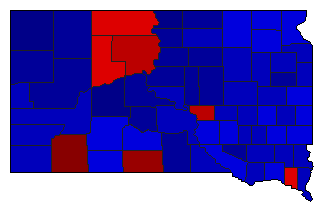
| Aurora | Hawks | 35.2% | |
| Noem | 57.8% | |
| 6.2% | |
| Other | 0.9% | |
| Beadle | Hawks | 32.9% | |
| Noem | 63.4% | |
| 2.5% | |
| Other | 1.2% | |
| Bennett | Hawks | 40.7% | |
| Noem | 56.1% | |
| 1.9% | |
| Other | 1.3% | |
| Bon Homme | Hawks | 34.7% | |
| Noem | 61.7% | |
| 2.3% | |
| Other | 1.3% | |
| Brookings | Hawks | 40.5% | |
| Noem | 55.1% | |
| 2.8% | |
| Other | 1.7% | |
| Brown | Hawks | 38.5% | |
| Noem | 58.6% | |
| 1.8% | |
| Other | 1.1% | |
| Brule | Hawks | 38.3% | |
| Noem | 58.0% | |
| 2.4% | |
| Other | 1.2% | |
| Buffalo | Hawks | 62.3% | |
| Noem | 32.5% | |
| 4.0% | |
| Other | 1.3% | |
| Butte | Hawks | 22.1% | |
| Noem | 74.0% | |
| 2.4% | |
| Other | 1.6% | |
| Campbell | Hawks | 14.9% | |
| Noem | 82.9% | |
| 1.2% | |
| Other | 1.0% | |
| Charles Mix | Hawks | 37.4% | |
| Noem | 59.1% | |
| 2.6% | |
| Other | 1.0% | |
| Clark | Hawks | 27.4% | |
| Noem | 69.7% | |
| 2.1% | |
| Other | 0.8% | |
| Clay | Hawks | 55.7% | |
| Noem | 41.4% | |
| 1.4% | |
| Other | 1.5% | |
| Codington | Hawks | 29.8% | |
| Noem | 67.5% | |
| 1.5% | |
| Other | 1.2% | |
| Corson | Hawks | 51.3% | |
| Noem | 44.6% | |
| 2.7% | |
| Other | 1.4% | |
| Custer | Hawks | 29.1% | |
| Noem | 67.2% | |
| 2.3% | |
| Other | 1.4% | |
| Davison | Hawks | 29.8% | |
| Noem | 66.3% | |
| 3.1% | |
| Other | 0.8% | |
| Day | Hawks | 39.5% | |
| Noem | 56.7% | |
| 2.5% | |
| Other | 1.3% | |
| Deuel | Hawks | 31.7% | |
| Noem | 64.6% | |
| 2.3% | |
| Other | 1.4% | |
| Dewey | Hawks | 60.5% | |
| Noem | 34.7% | |
| 3.3% | |
| Other | 1.5% | |
| Douglas | Hawks | 17.7% | |
| Noem | 77.8% | |
| 3.6% | |
| Other | 0.9% | |
| Edmunds | Hawks | 29.0% | |
| Noem | 68.1% | |
| 2.1% | |
| Other | 0.8% | |
| Fall River | Hawks | 27.7% | |
| Noem | 67.5% | |
| 2.6% | |
| Other | 2.2% | |
| Faulk | Hawks | 23.9% | |
| Noem | 73.2% | |
| 1.4% | |
| Other | 1.4% | |
| Grant | Hawks | 29.6% | |
| Noem | 66.5% | |
| 2.0% | |
| Other | 1.9% | |
| Gregory | Hawks | 27.6% | |
| Noem | 69.9% | |
| 1.8% | |
| Other | 0.6% | |
| Haakon | Hawks | 12.4% | |
| Noem | 84.7% | |
| 1.5% | |
| Other | 1.4% | |
| Hamlin | Hawks | 25.7% | |
| Noem | 71.6% | |
| 1.7% | |
| Other | 1.0% | |
| Hand | Hawks | 26.0% | |
| Noem | 71.0% | |
| 2.1% | |
| Other | 0.9% | |
| Hanson | Hawks | 33.6% | |
| Noem | 64.0% | |
| 1.9% | |
| Other | 0.4% | |
| Harding | Hawks | 13.8% | |
| Noem | 83.3% | |
| 1.6% | |
| Other | 1.3% | |
| Hughes | Hawks | 29.3% | |
| Noem | 67.4% | |
| 2.2% | |
| Other | 1.1% | |
| Hutchinson | Hawks | 27.0% | |
| Noem | 69.8% | |
| 2.5% | |
| Other | 0.8% | |
| Hyde | Hawks | 25.1% | |
| Noem | 70.8% | |
| 2.9% | |
| Other | 1.2% | |
| Jackson | Hawks | 38.1% | |
| Noem | 59.2% | |
| 2.1% | |
| Other | 0.7% | |
| Jerauld | Hawks | 34.4% | |
| Noem | 62.5% | |
| 2.2% | |
| Other | 0.9% | |
| Jones | Hawks | 17.3% | |
| Noem | 77.5% | |
| 3.1% | |
| Other | 2.0% | |
| Kingsbury | Hawks | 35.2% | |
| Noem | 62.0% | |
| 1.8% | |
| Other | 1.1% | |
| Lake | Hawks | 37.2% | |
| Noem | 60.2% | |
| 1.8% | |
| Other | 0.8% | |
| Lawrence | Hawks | 32.2% | |
| Noem | 63.3% | |
| 2.5% | |
| Other | 2.0% | |
| Lincoln | Hawks | 34.4% | |
| Noem | 62.7% | |
| 1.5% | |
| Other | 1.4% | |
| Lyman | Hawks | 36.2% | |
| Noem | 60.0% | |
| 2.3% | |
| Other | 1.5% | |
| McCook | Hawks | 42.1% | |
| Noem | 55.3% | |
| 1.8% | |
| Other | 0.8% | |
| McPherson | Hawks | 20.6% | |
| Noem | 76.2% | |
| 1.8% | |
| Other | 1.3% | |
| Marshall | Hawks | 44.2% | |
| Noem | 52.6% | |
| 1.7% | |
| Other | 1.4% | |
| Meade | Hawks | 24.7% | |
| Noem | 70.6% | |
| 2.7% | |
| Other | 2.0% | |
| Mellette | Hawks | 43.3% | |
| Noem | 51.2% | |
| 2.3% | |
| Other | 3.1% | |
| Miner | Hawks | 37.6% | |
| Noem | 58.4% | |
| 2.8% | |
| Other | 1.2% | |
| Minnehaha | Hawks | 42.0% | |
| Noem | 54.3% | |
| 1.9% | |
| Other | 1.8% | |
| Moody | Hawks | 38.6% | |
| Noem | 57.4% | |
| 2.5% | |
| Other | 1.5% | |
| Pennington | Hawks | 34.1% | |
| Noem | 61.5% | |
| 2.6% | |
| Other | 1.8% | |
| Perkins | Hawks | 16.8% | |
| Noem | 79.8% | |
| 1.8% | |
| Other | 1.6% | |
| Potter | Hawks | 20.7% | |
| Noem | 77.2% | |
| 1.0% | |
| Other | 1.1% | |
| Roberts | Hawks | 45.2% | |
| Noem | 52.0% | |
| 1.9% | |
| Other | 0.9% | |
| Sanborn | Hawks | 28.7% | |
| Noem | 66.7% | |
| 3.5% | |
| Other | 1.1% | |
| Oglala Lakota | Hawks | 83.5% | |
| Noem | 11.3% | |
| 3.5% | |
| Other | 1.6% | |
| Spink | Hawks | 34.5% | |
| Noem | 62.4% | |
| 2.2% | |
| Other | 0.9% | |
| Stanley | Hawks | 25.5% | |
| Noem | 70.5% | |
| 3.0% | |
| Other | 1.0% | |
| Sully | Hawks | 22.5% | |
| Noem | 75.8% | |
| 1.2% | |
| Other | 0.5% | |
| Todd | Hawks | 72.8% | |
| Noem | 23.1% | |
| 2.8% | |
| Other | 1.4% | |
| Tripp | Hawks | 22.8% | |
| Noem | 74.3% | |
| 2.0% | |
| Other | 1.0% | |
| Turner | Hawks | 32.8% | |
| Noem | 64.1% | |
| 1.8% | |
| Other | 1.2% | |
| Union | Hawks | 32.5% | |
| Noem | 64.7% | |
| 1.5% | |
| Other | 1.3% | |
| Walworth | Hawks | 23.5% | |
| Noem | 73.4% | |
| 1.8% | |
| Other | 1.2% | |
| Yankton | Hawks | 38.1% | |
| Noem | 58.4% | |
| 2.3% | |
| Other | 1.2% | |
| Ziebach | Hawks | 52.3% | |
| Noem | 42.7% | |
| 3.4% | |
| Other | 1.6% | |