2000 Presidential General Election Data Graphs - Utah
by County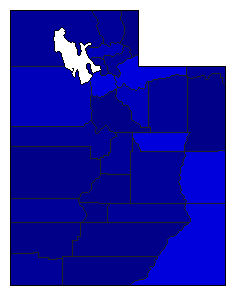
| Beaver | Gore | 24.0% | |
| Bush | 73.4% | |
| Nader | 1.7% | |
| Other | 0.9% | |
| Box Elder | Gore | 16.5% | |
| Bush | 79.4% | |
| Nader | 2.1% | |
| Other | 2.0% | |
| Cache | Gore | 15.6% | |
| Bush | 78.2% | |
| Nader | 4.6% | |
| Other | 1.6% | |
| Carbon | Gore | 44.7% | |
| Bush | 50.9% | |
| Nader | 2.9% | |
| Other | 1.6% | |
| Daggett | Gore | 23.9% | |
| Bush | 72.9% | |
| Nader | 2.1% | |
| Other | 1.1% | |
| Davis | Gore | 21.5% | |
| Bush | 73.3% | |
| Nader | 3.3% | |
| Other | 2.0% | |
| Duchesne | Gore | 17.1% | |
| Bush | 79.7% | |
| Nader | 1.7% | |
| Other | 1.5% | |
| Emery | Gore | 21.8% | |
| Bush | 73.7% | |
| Nader | 1.8% | |
| Other | 2.6% | |
| Garfield | Gore | 9.0% | |
| Bush | 87.3% | |
| Nader | 2.2% | |
| Other | 1.4% | |
| Grand | Gore | 32.0% | |
| Bush | 50.4% | |
| Nader | 14.9% | |
| Other | 2.6% | |
| Iron | Gore | 14.2% | |
| Bush | 80.2% | |
| Nader | 2.7% | |
| Other | 2.8% | |
| Juab | Gore | 22.2% | |
| Bush | 72.6% | |
| Nader | 2.2% | |
| Other | 3.0% | |
| Kane | Gore | 13.8% | |
| Bush | 80.4% | |
| Nader | 3.6% | |
| Other | 2.1% | |
| Millard | Gore | 14.6% | |
| Bush | 80.6% | |
| Nader | 1.5% | |
| Other | 3.3% | |
| Morgan | Gore | 17.4% | |
| Bush | 77.7% | |
| Nader | 2.5% | |
| Other | 2.3% | |
| Piute | Gore | 17.0% | |
| Bush | 80.2% | |
| Nader | 1.3% | |
| Other | 1.5% | |
| Rich | Gore | 16.8% | |
| Bush | 81.5% | |
| Nader | 1.1% | |
| Other | 0.6% | |
| Salt Lake | Gore | 35.0% | |
| Bush | 55.8% | |
| Nader | 6.9% | |
| Other | 2.2% | |
| San Juan | Gore | 38.7% | |
| Bush | 57.4% | |
| Nader | 2.3% | |
| Other | 1.6% | |
| Sanpete | Gore | 16.3% | |
| Bush | 77.8% | |
| Nader | 2.1% | |
| Other | 3.8% | |
| Sevier | Gore | 14.8% | |
| Bush | 81.4% | |
| Nader | 1.8% | |
| Other | 2.0% | |
| Summit | Gore | 38.0% | |
| Bush | 50.9% | |
| Nader | 9.5% | |
| Other | 1.6% | |
| Tooele | Gore | 32.1% | |
| Bush | 62.6% | |
| Nader | 3.1% | |
| Other | 2.3% | |
| Uintah | Gore | 16.5% | |
| Bush | 80.2% | |
| Nader | 1.6% | |
| Other | 1.7% | |
| Utah | Gore | 13.7% | |
| Bush | 81.7% | |
| Nader | 2.3% | |
| Other | 2.3% | |
| Wasatch | Gore | 26.0% | |
| Bush | 67.3% | |
| Nader | 4.6% | |
| Other | 2.1% | |
| Washington | Gore | 16.8% | |
| Bush | 78.5% | |
| Nader | 2.2% | |
| Other | 2.5% | |
| Wayne | Gore | 16.5% | |
| Bush | 77.8% | |
| Nader | 4.7% | |
| Other | 1.0% | |
| Weber | Gore | 31.7% | |
| Bush | 62.6% | |
| Nader | 3.8% | |
| Other | 2.0% | |