2018 Lt. Gubernatorial General Election Data Graphs - Arkansas
by CountyData for this Contest was Contributed by on 2019-03-14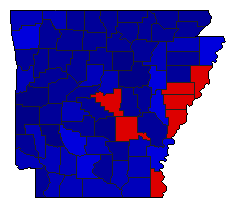
| Arkansas | Bland | 27.2% | |
| Griffin | 71.3% | |
| Other | 1.5% | |
| Ashley | Bland | 29.9% | |
| Griffin | 68.6% | |
| Other | 1.4% | |
| Baxter | Bland | 22.9% | |
| Griffin | 73.0% | |
| Other | 4.1% | |
| Benton | Bland | 30.5% | |
| Griffin | 66.6% | |
| Other | 2.9% | |
| Boone | Bland | 19.5% | |
| Griffin | 77.5% | |
| Other | 3.0% | |
| Bradley | Bland | 31.6% | |
| Griffin | 65.5% | |
| Other | 2.9% | |
| Calhoun | Bland | 24.7% | |
| Griffin | 73.1% | |
| Other | 2.1% | |
| Carroll | Bland | 34.7% | |
| Griffin | 62.5% | |
| Other | 2.7% | |
| Chicot | Bland | 55.2% | |
| Griffin | 43.4% | |
| Other | 1.4% | |
| Clark | Bland | 40.4% | |
| Griffin | 57.8% | |
| Other | 1.8% | |
| Clay | Bland | 24.2% | |
| Griffin | 73.4% | |
| Other | 2.4% | |
| Cleburne | Bland | 15.4% | |
| Griffin | 82.4% | |
| Other | 2.2% | |
| Cleveland | Bland | 19.1% | |
| Griffin | 79.6% | |
| Other | 1.3% | |
| Columbia | Bland | 32.9% | |
| Griffin | 65.8% | |
| Other | 1.3% | |
| Conway | Bland | 31.1% | |
| Griffin | 66.7% | |
| Other | 2.2% | |
| Craighead | Bland | 30.1% | |
| Griffin | 66.8% | |
| Other | 3.1% | |
| Crawford | Bland | 19.8% | |
| Griffin | 77.5% | |
| Other | 2.7% | |
| Crittenden | Bland | 51.5% | |
| Griffin | 46.6% | |
| Other | 2.0% | |
| Cross | Bland | 26.5% | |
| Griffin | 71.7% | |
| Other | 1.8% | |
| Dallas | Bland | 38.4% | |
| Griffin | 60.4% | |
| Other | 1.1% | |
| Desha | Bland | 46.0% | |
| Griffin | 51.0% | |
| Other | 2.9% | |
| Drew | Bland | 31.4% | |
| Griffin | 66.4% | |
| Other | 2.2% | |
| Faulkner | Bland | 30.8% | |
| Griffin | 66.1% | |
| Other | 3.1% | |
| Franklin | Bland | 20.0% | |
| Griffin | 77.4% | |
| Other | 2.6% | |
| Fulton | Bland | 26.2% | |
| Griffin | 71.3% | |
| Other | 2.4% | |
| Garland | Bland | 29.2% | |
| Griffin | 68.1% | |
| Other | 2.7% | |
| Grant | Bland | 16.4% | |
| Griffin | 81.5% | |
| Other | 2.1% | |
| Greene | Bland | 20.5% | |
| Griffin | 76.5% | |
| Other | 3.0% | |
| Hempstead | Bland | 33.0% | |
| Griffin | 65.3% | |
| Other | 1.7% | |
| Hot Spring | Bland | 25.2% | |
| Griffin | 72.4% | |
| Other | 2.4% | |
| Howard | Bland | 28.8% | |
| Griffin | 69.8% | |
| Other | 1.5% | |
| Independence | Bland | 19.3% | |
| Griffin | 77.8% | |
| Other | 2.9% | |
| Izard | Bland | 20.2% | |
| Griffin | 77.1% | |
| Other | 2.7% | |
| Jackson | Bland | 28.7% | |
| Griffin | 69.4% | |
| Other | 1.9% | |
| Jefferson | Bland | 56.6% | |
| Griffin | 41.1% | |
| Other | 2.3% | |
| Johnson | Bland | 24.8% | |
| Griffin | 71.7% | |
| Other | 3.5% | |
| Lafayette | Bland | 34.2% | |
| Griffin | 64.2% | |
| Other | 1.6% | |
| Lawrence | Bland | 22.6% | |
| Griffin | 74.6% | |
| Other | 2.8% | |
| Lee | Bland | 54.8% | |
| Griffin | 43.3% | |
| Other | 1.9% | |
| Lincoln | Bland | 28.4% | |
| Griffin | 69.3% | |
| Other | 2.3% | |
| Little River | Bland | 28.0% | |
| Griffin | 69.5% | |
| Other | 2.5% | |
| Logan | Bland | 20.8% | |
| Griffin | 76.3% | |
| Other | 2.8% | |
| Lonoke | Bland | 20.4% | |
| Griffin | 77.1% | |
| Other | 2.5% | |
| Madison | Bland | 25.4% | |
| Griffin | 71.7% | |
| Other | 2.9% | |
| Marion | Bland | 21.4% | |
| Griffin | 75.8% | |
| Other | 2.8% | |
| Miller | Bland | 26.3% | |
| Griffin | 72.4% | |
| Other | 1.3% | |
| Mississippi | Bland | 37.1% | |
| Griffin | 59.5% | |
| Other | 3.4% | |
| Monroe | Bland | 43.5% | |
| Griffin | 55.1% | |
| Other | 1.4% | |
| Montgomery | Bland | 20.2% | |
| Griffin | 77.9% | |
| Other | 1.9% | |
| Nevada | Bland | 35.4% | |
| Griffin | 63.3% | |
| Other | 1.3% | |
| Newton | Bland | 21.0% | |
| Griffin | 76.2% | |
| Other | 2.7% | |
| Ouachita | Bland | 42.6% | |
| Griffin | 55.8% | |
| Other | 1.6% | |
| Perry | Bland | 22.5% | |
| Griffin | 74.6% | |
| Other | 2.9% | |
| Phillips | Bland | 57.2% | |
| Griffin | 40.1% | |
| Other | 2.7% | |
| Pike | Bland | 17.0% | |
| Griffin | 81.0% | |
| Other | 1.9% | |
| Poinsett | Bland | 21.6% | |
| Griffin | 75.7% | |
| Other | 2.7% | |
| Polk | Bland | 15.1% | |
| Griffin | 81.8% | |
| Other | 3.1% | |
| Pope | Bland | 21.3% | |
| Griffin | 75.8% | |
| Other | 3.0% | |
| Prairie | Bland | 20.3% | |
| Griffin | 77.9% | |
| Other | 1.8% | |
| Pulaski | Bland | 51.9% | |
| Griffin | 44.9% | |
| Other | 3.2% | |
| Randolph | Bland | 22.6% | |
| Griffin | 73.8% | |
| Other | 3.7% | |
| St. Francis | Bland | 52.8% | |
| Griffin | 44.9% | |
| Other | 2.3% | |
| Saline | Bland | 24.1% | |
| Griffin | 72.8% | |
| Other | 3.0% | |
| Scott | Bland | 15.6% | |
| Griffin | 81.0% | |
| Other | 3.4% | |
| Searcy | Bland | 16.9% | |
| Griffin | 79.9% | |
| Other | 3.2% | |
| Sebastian | Bland | 26.9% | |
| Griffin | 69.4% | |
| Other | 3.7% | |
| Sevier | Bland | 22.3% | |
| Griffin | 74.7% | |
| Other | 3.1% | |
| Sharp | Bland | 20.0% | |
| Griffin | 77.5% | |
| Other | 2.5% | |
| Stone | Bland | 21.8% | |
| Griffin | 75.6% | |
| Other | 2.5% | |
| Union | Bland | 33.4% | |
| Griffin | 64.8% | |
| Other | 1.8% | |
| Van Buren | Bland | 19.2% | |
| Griffin | 77.7% | |
| Other | 3.1% | |
| Washington | Bland | 44.5% | |
| Griffin | 52.4% | |
| Other | 3.1% | |
| White | Bland | 17.2% | |
| Griffin | 80.4% | |
| Other | 2.4% | |
| Woodruff | Bland | 40.0% | |
| Griffin | 57.7% | |
| Other | 2.4% | |
| Yell | Bland | 20.9% | |
| Griffin | 76.6% | |
| Other | 2.5% | |