2008 Presidential General Election Data Graphs - Vermont
by County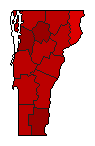
| Addison | Obama | 68.6% | |
| McCain | 29.5% | |
| Other | 1.9% | |
| Bennington | Obama | 65.5% | |
| McCain | 32.1% | |
| Other | 2.5% | |
| Caledonia | Obama | 60.4% | |
| McCain | 37.2% | |
| Other | 2.4% | |
| Chittenden | Obama | 71.4% | |
| McCain | 26.7% | |
| Other | 1.9% | |
| Essex | Obama | 55.9% | |
| McCain | 41.4% | |
| Other | 2.7% | |
| Franklin | Obama | 61.4% | |
| McCain | 36.6% | |
| Other | 2.0% | |
| Grand Isle | Obama | 63.1% | |
| McCain | 34.9% | |
| Other | 2.0% | |
| Lamoille | Obama | 70.4% | |
| McCain | 27.7% | |
| Other | 1.9% | |
| Orange | Obama | 64.6% | |
| McCain | 33.2% | |
| Other | 2.2% | |
| Orleans | Obama | 62.6% | |
| McCain | 35.1% | |
| Other | 2.3% | |
| Rutland | Obama | 61.2% | |
| McCain | 36.6% | |
| Other | 2.1% | |
| Washington | Obama | 69.3% | |
| McCain | 28.4% | |
| Other | 2.3% | |
| Windham | Obama | 73.0% | |
| McCain | 24.9% | |
| Other | 2.1% | |
| Windsor | Obama | 68.8% | |
| McCain | 29.1% | |
| Other | 2.0% | |