1976 Presidential General Election Data Graphs - Virginia
by County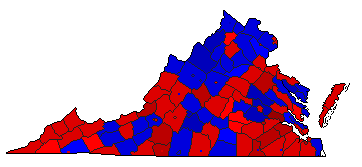
| Accomack | Carter | 50.4% | |
| Ford | 47.1% | |
| Other | 2.5% | |
| Albemarle | Carter | 44.0% | |
| Ford | 54.6% | |
| Other | 1.4% | |
| Alleghany | Carter | 57.7% | |
| Ford | 41.2% | |
| Other | 1.1% | |
| Amelia | Carter | 49.6% | |
| Ford | 47.3% | |
| Other | 3.2% | |
| Amherst | Carter | 47.3% | |
| Ford | 50.9% | |
| Other | 1.9% | |
| Appomattox | Carter | 44.1% | |
| Ford | 50.8% | |
| Other | 5.1% | |
| Arlington | Carter | 50.4% | |
| Ford | 47.9% | |
| Other | 1.7% | |
| Augusta | Carter | 38.3% | |
| Ford | 57.5% | |
| Other | 4.2% | |
| Bath | Carter | 53.3% | |
| Ford | 46.0% | |
| Other | 0.8% | |
| Bedford | Carter | 51.5% | |
| Ford | 45.3% | |
| Other | 3.1% | |
| Bland | Carter | 47.6% | |
| Ford | 51.9% | |
| Other | 0.4% | |
| Botetourt | Carter | 53.1% | |
| Ford | 44.1% | |
| Other | 2.8% | |
| Brunswick | Carter | 54.2% | |
| Ford | 42.1% | |
| Other | 3.7% | |
| Buchanan | Carter | 54.0% | |
| Ford | 35.9% | |
| Other | 10.1% | |
| Buckingham | Carter | 58.0% | |
| Ford | 39.6% | |
| Other | 2.4% | |
| Campbell | Carter | 35.6% | |
| Ford | 60.8% | |
| Other | 3.7% | |
| Caroline | Carter | 63.9% | |
| Ford | 34.4% | |
| Other | 1.8% | |
| Carroll | Carter | 44.7% | |
| Ford | 53.7% | |
| Other | 1.5% | |
| Charles City | Carter | 74.6% | |
| Ford | 22.5% | |
| Other | 2.9% | |
| Charlotte | Carter | 52.6% | |
| Ford | 46.0% | |
| Other | 1.3% | |
| Chesterfield | Carter | 33.3% | |
| Ford | 65.5% | |
| Other | 1.2% | |
| Clarke | Carter | 45.7% | |
| Ford | 51.5% | |
| Other | 2.8% | |
| Craig | Carter | 66.2% | |
| Ford | 32.8% | |
| Other | 1.1% | |
| Culpeper | Carter | 43.2% | |
| Ford | 54.6% | |
| Other | 2.2% | |
| Cumberland | Carter | 47.2% | |
| Ford | 46.6% | |
| Other | 6.2% | |
| Dickenson | Carter | 55.8% | |
| Ford | 42.3% | |
| Other | 1.9% | |
| Dinwiddie | Carter | 59.8% | |
| Ford | 37.3% | |
| Other | 2.9% | |
| Essex | Carter | 47.8% | |
| Ford | 50.5% | |
| Other | 1.6% | |
| Fairfax | Carter | 44.7% | |
| Ford | 53.6% | |
| Other | 1.7% | |
| Fauquier | Carter | 43.9% | |
| Ford | 51.8% | |
| Other | 4.3% | |
| Floyd | Carter | 44.0% | |
| Ford | 52.8% | |
| Other | 3.2% | |
| Fluvanna | Carter | 51.1% | |
| Ford | 46.8% | |
| Other | 2.1% | |
| Franklin | Carter | 63.1% | |
| Ford | 34.6% | |
| Other | 2.2% | |
| Frederick | Carter | 39.1% | |
| Ford | 59.5% | |
| Other | 1.4% | |
| Giles | Carter | 56.1% | |
| Ford | 40.5% | |
| Other | 3.4% | |
| Gloucester | Carter | 49.3% | |
| Ford | 47.2% | |
| Other | 3.5% | |
| Goochland | Carter | 50.7% | |
| Ford | 47.2% | |
| Other | 2.1% | |
| Grayson | Carter | 50.3% | |
| Ford | 48.3% | |
| Other | 1.3% | |
| Greene | Carter | 42.0% | |
| Ford | 51.4% | |
| Other | 6.6% | |
| Greensville | Carter | 66.2% | |
| Ford | 31.2% | |
| Other | 2.6% | |
| Halifax | Carter | 50.0% | |
| Ford | 46.5% | |
| Other | 3.4% | |
| Hanover | Carter | 34.0% | |
| Ford | 64.7% | |
| Other | 1.3% | |
| Henrico | Carter | 31.5% | |
| Ford | 65.8% | |
| Other | 2.7% | |
| Henry | Carter | 60.4% | |
| Ford | 35.0% | |
| Other | 4.6% | |
| Highland | Carter | 43.6% | |
| Ford | 55.6% | |
| Other | 0.9% | |
| Isle of Wight | Carter | 59.1% | |
| Ford | 38.8% | |
| Other | 2.1% | |
| James City | Carter | 46.5% | |
| Ford | 49.4% | |
| Other | 4.2% | |
| King and Queen | Carter | 55.8% | |
| Ford | 39.1% | |
| Other | 5.2% | |
| King George | Carter | 51.1% | |
| Ford | 46.8% | |
| Other | 2.1% | |
| King William | Carter | 47.6% | |
| Ford | 50.6% | |
| Other | 1.8% | |
| Lancaster | Carter | 38.8% | |
| Ford | 58.4% | |
| Other | 2.7% | |
| Lee | Carter | 52.7% | |
| Ford | 45.5% | |
| Other | 1.8% | |
| Loudoun | Carter | 45.0% | |
| Ford | 51.8% | |
| Other | 3.2% | |
| Louisa | Carter | 55.6% | |
| Ford | 41.9% | |
| Other | 2.5% | |
| Lunenburg | Carter | 47.6% | |
| Ford | 49.7% | |
| Other | 2.7% | |
| Madison | Carter | 45.4% | |
| Ford | 53.0% | |
| Other | 1.6% | |
| Mathews | Carter | 39.6% | |
| Ford | 57.8% | |
| Other | 2.6% | |
| Mecklenburg | Carter | 46.5% | |
| Ford | 50.4% | |
| Other | 3.1% | |
| Middlesex | Carter | 43.2% | |
| Ford | 52.9% | |
| Other | 3.9% | |
| Montgomery | Carter | 47.9% | |
| Ford | 50.6% | |
| Other | 1.5% | |
| Nelson | Carter | 60.2% | |
| Ford | 37.6% | |
| Other | 2.1% | |
| New Kent | Carter | 50.6% | |
| Ford | 47.6% | |
| Other | 1.8% | |
| Northampton | Carter | 51.9% | |
| Ford | 43.1% | |
| Other | 4.9% | |
| Northumberland | Carter | 44.0% | |
| Ford | 52.5% | |
| Other | 3.5% | |
| Nottoway | Carter | 49.0% | |
| Ford | 47.6% | |
| Other | 3.4% | |
| Orange | Carter | 44.7% | |
| Ford | 49.4% | |
| Other | 5.9% | |
| Page | Carter | 46.4% | |
| Ford | 51.5% | |
| Other | 2.1% | |
| Patrick | Carter | 51.0% | |
| Ford | 43.7% | |
| Other | 5.4% | |
| Pittsylvania | Carter | 44.3% | |
| Ford | 51.2% | |
| Other | 4.5% | |
| Powhatan | Carter | 42.0% | |
| Ford | 55.3% | |
| Other | 2.7% | |
| Prince Edward | Carter | 45.1% | |
| Ford | 50.4% | |
| Other | 4.5% | |
| Prince George | Carter | 53.0% | |
| Ford | 45.4% | |
| Other | 1.5% | |
| Prince William | Carter | 48.3% | |
| Ford | 49.0% | |
| Other | 2.7% | |
| Pulaski | Carter | 52.2% | |
| Ford | 44.8% | |
| Other | 3.0% | |
| Rappahannock | Carter | 54.1% | |
| Ford | 44.5% | |
| Other | 1.5% | |
| Richmond | Carter | 37.8% | |
| Ford | 60.8% | |
| Other | 1.4% | |
| Roanoke | Carter | 48.7% | |
| Ford | 50.4% | |
| Other | 0.9% | |
| Rockbridge | Carter | 51.1% | |
| Ford | 43.7% | |
| Other | 5.2% | |
| Rockingham | Carter | 33.9% | |
| Ford | 61.9% | |
| Other | 4.3% | |
| Russell | Carter | 56.4% | |
| Ford | 40.2% | |
| Other | 3.4% | |
| Scott | Carter | 47.4% | |
| Ford | 45.4% | |
| Other | 7.2% | |
| Shenandoah | Carter | 34.2% | |
| Ford | 64.0% | |
| Other | 1.7% | |
| Smyth | Carter | 49.3% | |
| Ford | 47.3% | |
| Other | 3.4% | |
| Southampton | Carter | 57.7% | |
| Ford | 40.2% | |
| Other | 2.1% | |
| Spotsylvania | Carter | 55.7% | |
| Ford | 42.5% | |
| Other | 1.9% | |
| Stafford | Carter | 51.6% | |
| Ford | 46.8% | |
| Other | 1.6% | |
| Surry | Carter | 64.6% | |
| Ford | 32.8% | |
| Other | 2.6% | |
| Sussex | Carter | 61.0% | |
| Ford | 33.2% | |
| Other | 5.8% | |
| Tazewell | Carter | 56.3% | |
| Ford | 41.4% | |
| Other | 2.3% | |
| Warren | Carter | 49.4% | |
| Ford | 45.8% | |
| Other | 4.8% | |
| Washington | Carter | 46.7% | |
| Ford | 49.0% | |
| Other | 4.3% | |
| Westmoreland | Carter | 51.6% | |
| Ford | 41.8% | |
| Other | 6.7% | |
| Wise | Carter | 53.4% | |
| Ford | 42.6% | |
| Other | 3.9% | |
| Wythe | Carter | 43.4% | |
| Ford | 51.3% | |
| Other | 5.2% | |
| York | Carter | 45.3% | |
| Ford | 53.6% | |
| Other | 1.1% | |
City| Alexandria | Carter | 52.4% | |
| Ford | 44.5% | |
| Other | 3.1% | |
| Bedford | Carter | 48.9% | |
| Ford | 45.5% | |
| Other | 5.6% | |
| Bristol | Carter | 52.6% | |
| Ford | 46.3% | |
| Other | 1.2% | |
| Buena Vista | Carter | 53.6% | |
| Ford | 41.6% | |
| Other | 4.8% | |
| Charlottesville | Carter | 49.4% | |
| Ford | 48.1% | |
| Other | 2.5% | |
| Chesapeake | Carter | 54.9% | |
| Ford | 40.0% | |
| Other | 5.1% | |
| Clifton Forge | Carter | 52.5% | |
| Ford | 40.7% | |
| Other | 6.9% | |
| Colonial Heights | Carter | 34.7% | |
| Ford | 61.9% | |
| Other | 3.4% | |
| Covington | Carter | 57.5% | |
| Ford | 37.1% | |
| Other | 5.4% | |
| Danville | Carter | 37.3% | |
| Ford | 59.5% | |
| Other | 3.2% | |
| Emporia | Carter | 44.5% | |
| Ford | 52.2% | |
| Other | 3.3% | |
| Fairfax | Carter | 44.3% | |
| Ford | 53.4% | |
| Other | 2.4% | |
| Falls Church | Carter | 48.0% | |
| Ford | 50.6% | |
| Other | 1.4% | |
| Franklin | Carter | 48.7% | |
| Ford | 49.2% | |
| Other | 2.1% | |
| Fredericksburg | Carter | 49.5% | |
| Ford | 49.1% | |
| Other | 1.4% | |
| Galax | Carter | 51.4% | |
| Ford | 47.6% | |
| Other | 1.0% | |
| Hampton | Carter | 53.3% | |
| Ford | 41.7% | |
| Other | 5.1% | |
| Harrisonburg | Carter | 33.7% | |
| Ford | 63.0% | |
| Other | 3.3% | |
| Hopewell | Carter | 47.3% | |
| Ford | 48.2% | |
| Other | 4.5% | |
| Lexington | Carter | 46.4% | |
| Ford | 50.5% | |
| Other | 3.1% | |
| Lynchburg | Carter | 34.6% | |
| Ford | 61.2% | |
| Other | 4.3% | |
| Manassas | Carter | 44.0% | |
| Ford | 53.3% | |
| Other | 2.6% | |
| Manassas Park | Carter | 59.6% | |
| Ford | 37.3% | |
| Other | 3.0% | |
| Martinsville | Carter | 50.3% | |
| Ford | 45.4% | |
| Other | 4.3% | |
| Newport News | Carter | 51.8% | |
| Ford | 47.0% | |
| Other | 1.2% | |
| Norfolk | Carter | 55.8% | |
| Ford | 39.9% | |
| Other | 4.3% | |
| Norton | Carter | 56.7% | |
| Ford | 40.3% | |
| Other | 2.9% | |
| Petersburg | Carter | 60.0% | |
| Ford | 38.5% | |
| Other | 1.4% | |
| Poquoson | Carter | 43.2% | |
| Ford | 55.3% | |
| Other | 1.5% | |
| Portsmouth | Carter | 63.0% | |
| Ford | 35.5% | |
| Other | 1.5% | |
| Radford | Carter | 54.3% | |
| Ford | 44.7% | |
| Other | 0.9% | |
| Richmond | Carter | 53.8% | |
| Ford | 44.7% | |
| Other | 1.5% | |
| Roanoke | Carter | 57.6% | |
| Ford | 41.0% | |
| Other | 1.4% | |
| Salem | Carter | 50.7% | |
| Ford | 48.3% | |
| Other | 1.0% | |
| South Boston | Carter | 41.1% | |
| Ford | 57.0% | |
| Other | 2.0% | |
| Staunton | Carter | 37.5% | |
| Ford | 59.5% | |
| Other | 2.9% | |
| Suffolk | Carter | 59.2% | |
| Ford | 38.9% | |
| Other | 1.9% | |
| Virginia Beach | Carter | 40.7% | |
| Ford | 54.5% | |
| Other | 4.9% | |
| Waynesboro | Carter | 37.3% | |
| Ford | 59.6% | |
| Other | 3.0% | |
| Williamsburg | Carter | 45.9% | |
| Ford | 51.8% | |
| Other | 2.3% | |
| Winchester | Carter | 36.2% | |
| Ford | 62.8% | |
| Other | 1.0% | |