1976 Presidential General Election Data Graphs - Wisconsin
Note: The Google advertisement links below may advocate political positions that this site does not endorse.
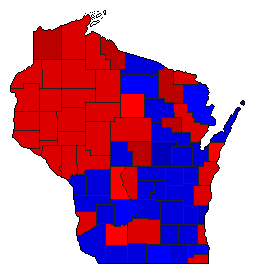
Map

AdamsCarter55.3%
 
Ford42.5%
 
Other2.2%


AshlandCarter58.9%
 
Ford38.2%
 
Other2.9%


BarronCarter53.0%
 
Ford45.1%
 
Other1.9%


BayfieldCarter58.0%
 
Ford39.2%
 
Other2.7%


BrownCarter46.5%
 
Ford50.6%
 
Other2.9%


BuffaloCarter53.6%
 
Ford44.3%
 
Other2.1%


BurnettCarter57.7%
 
Ford39.9%
 
Other2.3%


CalumetCarter47.5%
 
Ford50.2%
 
Other2.3%


ChippewaCarter57.4%
 
Ford40.5%
 
Other2.1%


ClarkCarter52.7%
 
Ford44.4%
 
Other3.0%


ColumbiaCarter47.5%
 
Ford50.6%
 
Other1.8%


CrawfordCarter50.4%
 
Ford47.1%
 
Other2.5%


DaneCarter54.0%
 
Ford41.6%
 
Other4.4%


DodgeCarter43.1%
 
Ford54.8%
 
Other2.1%


DoorCarter39.9%
 
Ford57.4%
 
Other2.7%


DouglasCarter64.3%
 
Ford33.4%
 
Other2.3%


DunnCarter52.5%
 
Ford45.0%
 
Other2.5%


Eau ClaireCarter51.7%
 
Ford46.4%
 
Other2.0%


FlorenceCarter50.2%
 
Ford48.0%
 
Other1.8%


Fond du LacCarter41.6%
 
Ford55.8%
 
Other2.6%


ForestCarter60.7%
 
Ford37.8%
 
Other1.4%


GrantCarter43.4%
 
Ford54.1%
 
Other2.5%


GreenCarter43.2%
 
Ford54.3%
 
Other2.5%


Green LakeCarter39.7%
 
Ford58.4%
 
Other1.9%


IowaCarter49.0%
 
Ford48.3%
 
Other2.7%


IronCarter63.1%
 
Ford35.3%
 
Other1.6%


JacksonCarter51.4%
 
Ford46.9%
 
Other1.7%


JeffersonCarter43.7%
 
Ford53.9%
 
Other2.5%


JuneauCarter49.7%
 
Ford46.7%
 
Other3.6%


KenoshaCarter53.8%
 
Ford43.6%
 
Other2.6%


KewauneeCarter49.6%
 
Ford47.9%
 
Other2.4%


La CrosseCarter40.0%
 
Ford58.1%
 
Other1.9%


LafayetteCarter46.9%
 
Ford50.5%
 
Other2.6%


LangladeCarter46.3%
 
Ford51.8%
 
Other1.9%


LincolnCarter49.5%
 
Ford48.4%
 
Other2.1%


ManitowocCarter53.9%
 
Ford43.6%
 
Other2.5%


MarathonCarter51.9%
 
Ford45.6%
 
Other2.4%


MarinetteCarter48.7%
 
Ford49.3%
 
Other2.0%


MarquetteCarter48.3%
 
Ford50.0%
 
Other1.7%


MenomineeCarter68.3%
 
Ford28.9%
 
Other2.9%


MilwaukeeCarter54.7%
 
Ford42.1%
 
Other3.2%


MonroeCarter46.3%
 
Ford51.8%
 
Other1.9%


OcontoCarter50.2%
 
Ford47.8%
 
Other1.9%


OneidaCarter48.4%
 
Ford49.3%
 
Other2.4%


OutagamieCarter44.0%
 
Ford54.0%
 
Other2.0%


OzaukeeCarter35.4%
 
Ford62.2%
 
Other2.5%


PepinCarter58.6%
 
Ford39.4%
 
Other2.0%


PierceCarter57.2%
 
Ford40.4%
 
Other2.5%


PolkCarter56.9%
 
Ford41.3%
 
Other1.9%


PortageCarter60.6%
 
Ford36.3%
 
Other3.1%


PriceCarter54.4%
 
Ford43.3%
 
Other2.3%


RacineCarter48.5%
 
Ford49.0%
 
Other2.5%


RichlandCarter44.0%
 
Ford54.1%
 
Other1.8%


RockCarter48.6%
 
Ford49.0%
 
Other2.4%


RuskCarter58.2%
 
Ford39.2%
 
Other2.6%


St. CroixCarter56.8%
 
Ford41.2%
 
Other2.1%


SaukCarter48.0%
 
Ford49.9%
 
Other2.1%


SawyerCarter51.7%
 
Ford46.1%
 
Other2.2%


ShawanoCarter43.4%
 
Ford54.6%
 
Other2.0%


SheboyganCarter51.1%
 
Ford47.1%
 
Other1.7%


TaylorCarter51.9%
 
Ford45.4%
 
Other2.6%


TrempealeauCarter53.0%
 
Ford45.6%
 
Other1.4%


VernonCarter46.5%
 
Ford51.6%
 
Other1.9%


VilasCarter38.6%
 
Ford59.3%
 
Other2.1%


WalworthCarter39.7%
 
Ford57.8%
 
Other2.5%


WashburnCarter54.3%
 
Ford43.2%
 
Other2.5%


WashingtonCarter42.3%
 
Ford55.2%
 
Other2.5%


WaukeshaCarter39.3%
 
Ford58.2%
 
Other2.5%


WaupacaCarter38.0%
 
Ford60.1%
 
Other1.9%


WausharaCarter43.0%
 
Ford54.9%
 
Other2.0%


WinnebagoCarter42.2%
 
Ford55.4%
 
Other2.5%


WoodCarter47.6%
 
Ford50.0%
 
Other2.4%


National DataGraph for 1976 - Wisconsin Results for 1976

Login

Terms of Use - DCMA Policy - Privacy Policy and Cookies


© Dave Leip's Atlas of U.S. Elections, LLC 2019 All Rights Reserved