1992 Presidential General Election Data Graphs - Wisconsin
Note: The Google advertisement links below may advocate political positions that this site does not endorse.
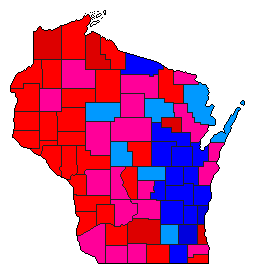
Map

AdamsClinton44.0%
 
Bush30.6%
 
Perot24.9%
 
Other0.5%


AshlandClinton50.2%
 
Bush28.3%
 
Perot20.8%
 
Other0.7%


BarronClinton39.9%
 
Bush32.5%
 
Perot27.1%
 
Other0.6%


BayfieldClinton47.7%
 
Bush29.5%
 
Perot22.0%
 
Other0.7%


BrownClinton36.5%
 
Bush41.2%
 
Perot21.8%
 
Other0.4%


BuffaloClinton43.1%
 
Bush29.2%
 
Perot27.2%
 
Other0.5%


BurnettClinton42.7%
 
Bush31.5%
 
Perot24.9%
 
Other0.9%


CalumetClinton31.0%
 
Bush41.0%
 
Perot27.5%
 
Other0.6%


ChippewaClinton41.6%
 
Bush32.6%
 
Perot25.4%
 
Other0.5%


ClarkClinton37.2%
 
Bush33.4%
 
Perot28.8%
 
Other0.6%


ColumbiaClinton39.0%
 
Bush37.9%
 
Perot22.7%
 
Other0.4%


CrawfordClinton45.3%
 
Bush30.6%
 
Perot23.0%
 
Other1.1%


DaneClinton54.6%
 
Bush29.5%
 
Perot15.2%
 
Other0.7%


DodgeClinton32.0%
 
Bush41.9%
 
Perot25.6%
 
Other0.5%


DoorClinton34.4%
 
Bush39.7%
 
Perot25.4%
 
Other0.5%


DouglasClinton55.4%
 
Bush25.5%
 
Perot18.6%
 
Other0.5%


DunnClinton43.7%
 
Bush29.0%
 
Perot26.4%
 
Other0.9%


Eau ClaireClinton45.1%
 
Bush33.8%
 
Perot20.8%
 
Other0.3%


FlorenceClinton37.0%
 
Bush35.6%
 
Perot27.2%
 
Other0.3%


Fond du LacClinton30.9%
 
Bush44.5%
 
Perot24.0%
 
Other0.7%


ForestClinton43.6%
 
Bush31.9%
 
Perot24.3%
 
Other0.2%


GrantClinton38.5%
 
Bush33.2%
 
Perot27.7%
 
Other0.7%


GreenClinton38.5%
 
Bush34.5%
 
Perot26.3%
 
Other0.7%


Green LakeClinton29.1%
 
Bush40.8%
 
Perot29.6%
 
Other0.5%


IowaClinton44.0%
 
Bush32.4%
 
Perot23.1%
 
Other0.5%


IronClinton45.3%
 
Bush32.7%
 
Perot21.5%
 
Other0.5%


JacksonClinton43.7%
 
Bush31.4%
 
Perot24.2%
 
Other0.6%


JeffersonClinton35.3%
 
Bush39.9%
 
Perot24.3%
 
Other0.5%


JuneauClinton38.0%
 
Bush36.9%
 
Perot24.3%
 
Other0.9%


KenoshaClinton44.2%
 
Bush32.1%
 
Perot23.0%
 
Other0.7%


KewauneeClinton39.0%
 
Bush34.4%
 
Perot26.0%
 
Other0.5%


La CrosseClinton43.7%
 
Bush36.1%
 
Perot19.6%
 
Other0.6%


LafayetteClinton40.0%
 
Bush32.9%
 
Perot26.5%
 
Other0.7%


LangladeClinton36.1%
 
Bush38.7%
 
Perot24.3%
 
Other0.8%


LincolnClinton39.8%
 
Bush32.5%
 
Perot27.1%
 
Other0.6%


ManitowocClinton38.5%
 
Bush33.9%
 
Perot27.1%
 
Other0.4%


MarathonClinton37.4%
 
Bush36.5%
 
Perot25.4%
 
Other0.6%


MarinetteClinton36.2%
 
Bush37.9%
 
Perot25.7%
 
Other0.3%


MarquetteClinton37.7%
 
Bush34.6%
 
Perot27.1%
 
Other0.7%


MenomineeClinton59.6%
 
Bush21.0%
 
Perot19.1%
 
Other0.3%


MilwaukeeClinton50.6%
 
Bush32.5%
 
Perot16.3%
 
Other0.6%


MonroeClinton38.2%
 
Bush36.4%
 
Perot24.9%
 
Other0.5%


OcontoClinton36.7%
 
Bush35.6%
 
Perot27.4%
 
Other0.3%


OneidaClinton38.3%
 
Bush35.9%
 
Perot25.6%
 
Other0.3%


OutagamieClinton32.6%
 
Bush41.7%
 
Perot25.3%
 
Other0.4%


OzaukeeClinton27.7%
 
Bush53.1%
 
Perot18.6%
 
Other0.5%


PepinClinton46.8%
 
Bush30.7%
 
Perot21.9%
 
Other0.6%


PierceClinton45.3%
 
Bush28.0%
 
Perot26.0%
 
Other0.6%


PolkClinton42.9%
 
Bush30.1%
 
Perot26.3%
 
Other0.7%


PortageClinton46.1%
 
Bush32.4%
 
Perot21.0%
 
Other0.5%


PriceClinton41.8%
 
Bush31.0%
 
Perot26.7%
 
Other0.4%


RacineClinton39.7%
 
Bush36.8%
 
Perot23.0%
 
Other0.5%


RichlandClinton40.5%
 
Bush36.8%
 
Perot22.2%
 
Other0.5%


RockClinton45.1%
 
Bush31.8%
 
Perot22.7%
 
Other0.3%


RuskClinton42.4%
 
Bush30.5%
 
Perot26.2%
 
Other1.0%


St. CroixClinton40.0%
 
Bush31.6%
 
Perot27.7%
 
Other0.6%


SaukClinton39.0%
 
Bush37.9%
 
Perot22.5%
 
Other0.5%


SawyerClinton38.0%
 
Bush36.1%
 
Perot25.3%
 
Other0.7%


ShawanoClinton33.8%
 
Bush40.4%
 
Perot25.3%
 
Other0.5%


SheboyganClinton37.7%
 
Bush41.3%
 
Perot20.7%
 
Other0.3%


TaylorClinton35.3%
 
Bush36.5%
 
Perot27.7%
 
Other0.5%


TrempealeauClinton47.8%
 
Bush27.5%
 
Perot24.3%
 
Other0.4%


VernonClinton44.6%
 
Bush32.0%
 
Perot22.7%
 
Other0.6%


VilasClinton33.4%
 
Bush41.0%
 
Perot25.1%
 
Other0.5%


WalworthClinton32.1%
 
Bush42.7%
 
Perot24.5%
 
Other0.6%


WashburnClinton40.1%
 
Bush33.6%
 
Perot25.7%
 
Other0.5%


WashingtonClinton26.6%
 
Bush45.4%
 
Perot26.1%
 
Other1.9%


WaukeshaClinton28.1%
 
Bush51.0%
 
Perot20.4%
 
Other0.5%


WaupacaClinton28.8%
 
Bush44.3%
 
Perot26.3%
 
Other0.7%


WausharaClinton32.9%
 
Bush39.2%
 
Perot27.4%
 
Other0.5%


WinnebagoClinton35.2%
 
Bush43.6%
 
Perot20.9%
 
Other0.4%


WoodClinton36.2%
 
Bush38.0%
 
Perot24.2%
 
Other1.5%


National DataGraph for 1992 - Wisconsin Results for 1992

Login

Terms of Use - DCMA Policy - Privacy Policy and Cookies


© Dave Leip's Atlas of U.S. Elections, LLC 2019 All Rights Reserved