1960 Lt. Gubernatorial General Election Data Graphs - Massachusetts
by CountyData for this Contest was Contributed by on 2012-06-14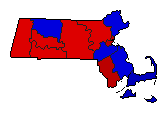
| Barnstable | McLaughlin | 33.6% | |
| Means | 66.0% | |
| Other | 0.4% | |
| Berkshire | McLaughlin | 53.0% | |
| Means | 46.1% | |
| Other | 0.9% | |
| Bristol | McLaughlin | 65.0% | |
| Means | 34.3% | |
| Other | 0.7% | |
| Dukes | McLaughlin | 34.4% | |
| Means | 65.2% | |
| Other | 0.4% | |
| Essex | McLaughlin | 47.1% | |
| Means | 51.8% | |
| Other | 1.1% | |
| Franklin | McLaughlin | 42.0% | |
| Means | 56.3% | |
| Other | 1.7% | |
| Hampden | McLaughlin | 55.7% | |
| Means | 43.2% | |
| Other | 1.2% | |
| Hampshire | McLaughlin | 51.6% | |
| Means | 47.3% | |
| Other | 1.2% | |
| Middlesex | McLaughlin | 51.9% | |
| Means | 47.2% | |
| Other | 0.9% | |
| Nantucket | McLaughlin | 32.6% | |
| Means | 67.1% | |
| Other | 0.3% | |
| Norfolk | McLaughlin | 46.1% | |
| Means | 53.3% | |
| Other | 0.6% | |
| Plymouth | McLaughlin | 44.6% | |
| Means | 54.8% | |
| Other | 0.6% | |
| Suffolk | McLaughlin | 69.2% | |
| Means | 29.7% | |
| Other | 1.1% | |
| Worcester | McLaughlin | 56.4% | |
| Means | 42.7% | |
| Other | 0.8% | |