1960 Gubernatorial General Election Data Graphs - Utah
by CountyData for this Contest was Contributed by on 2008-03-21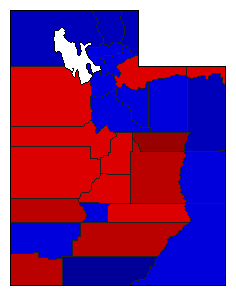
| Beaver | Barlocker | 65.5% | |
| Clyde | 34.5% | |
| Box Elder | Barlocker | 39.2% | |
| Clyde | 60.8% | |
| Cache | Barlocker | 37.8% | |
| Clyde | 62.2% | |
| Carbon | Barlocker | 72.8% | |
| Clyde | 27.2% | |
| Daggett | Barlocker | 55.3% | |
| Clyde | 44.7% | |
| Davis | Barlocker | 42.5% | |
| Clyde | 57.5% | |
| Duchesne | Barlocker | 48.0% | |
| Clyde | 52.0% | |
| Emery | Barlocker | 65.0% | |
| Clyde | 35.0% | |
| Garfield | Barlocker | 62.4% | |
| Clyde | 37.6% | |
| Grand | Barlocker | 47.3% | |
| Clyde | 52.7% | |
| Iron | Barlocker | 49.4% | |
| Clyde | 50.6% | |
| Juab | Barlocker | 53.6% | |
| Clyde | 46.4% | |
| Kane | Barlocker | 29.7% | |
| Clyde | 70.3% | |
| Millard | Barlocker | 50.2% | |
| Clyde | 49.8% | |
| Morgan | Barlocker | 47.4% | |
| Clyde | 52.6% | |
| Piute | Barlocker | 45.4% | |
| Clyde | 54.6% | |
| Rich | Barlocker | 33.9% | |
| Clyde | 66.1% | |
| Salt Lake | Barlocker | 45.6% | |
| Clyde | 54.4% | |
| San Juan | Barlocker | 49.2% | |
| Clyde | 50.8% | |
| Sanpete | Barlocker | 50.4% | |
| Clyde | 49.6% | |
| Sevier | Barlocker | 51.0% | |
| Clyde | 49.0% | |
| Summit | Barlocker | 50.6% | |
| Clyde | 49.4% | |
| Tooele | Barlocker | 58.7% | |
| Clyde | 41.3% | |
| Uintah | Barlocker | 39.7% | |
| Clyde | 60.3% | |
| Utah | Barlocker | 49.4% | |
| Clyde | 50.6% | |
| Wasatch | Barlocker | 45.3% | |
| Clyde | 54.7% | |
| Washington | Barlocker | 68.2% | |
| Clyde | 31.8% | |
| Wayne | Barlocker | 55.2% | |
| Clyde | 44.8% | |
| Weber | Barlocker | 47.8% | |
| Clyde | 52.2% | |