1964 Presidential General Election Data Graphs - Massachusetts
by County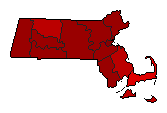
| Barnstable | Johnson | 56.9% | |
| Goldwater | 42.8% | |
| Unpledged | 0.0% | |
| Other | 0.3% | |
| Berkshire | Johnson | 75.9% | |
| Goldwater | 23.6% | |
| Unpledged | 0.0% | |
| Other | 0.5% | |
| Bristol | Johnson | 78.7% | |
| Goldwater | 21.0% | |
| Unpledged | 0.0% | |
| Other | 0.3% | |
| Dukes | Johnson | 68.0% | |
| Goldwater | 31.6% | |
| Unpledged | 0.0% | |
| Other | 0.4% | |
| Essex | Johnson | 74.3% | |
| Goldwater | 25.3% | |
| Unpledged | 0.0% | |
| Other | 0.4% | |
| Franklin | Johnson | 66.8% | |
| Goldwater | 32.6% | |
| Unpledged | 0.0% | |
| Other | 0.7% | |
| Hampden | Johnson | 74.7% | |
| Goldwater | 24.9% | |
| Unpledged | 0.0% | |
| Other | 0.5% | |
| Hampshire | Johnson | 73.5% | |
| Goldwater | 26.1% | |
| Unpledged | 0.0% | |
| Other | 0.5% | |
| Middlesex | Johnson | 76.2% | |
| Goldwater | 23.4% | |
| Unpledged | 0.0% | |
| Other | 0.4% | |
| Nantucket | Johnson | 67.0% | |
| Goldwater | 32.8% | |
| Unpledged | 0.0% | |
| Other | 0.2% | |
| Norfolk | Johnson | 72.8% | |
| Goldwater | 26.8% | |
| Unpledged | 0.0% | |
| Other | 0.4% | |
| Plymouth | Johnson | 68.1% | |
| Goldwater | 31.5% | |
| Unpledged | 0.0% | |
| Other | 0.3% | |
| Suffolk | Johnson | 86.2% | |
| Goldwater | 13.5% | |
| Unpledged | 0.0% | |
| Other | 0.3% | |
| Worcester | Johnson | 77.1% | |
| Goldwater | 22.6% | |
| Unpledged | 0.0% | |
| Other | 0.3% | |