1964 Secretary of State General Election Data Graphs - Massachusetts
by CountyData for this Contest was Contributed by on 2012-06-14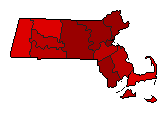
| Barnstable | White | 55.1% | |
| Crawford | 44.5% | |
| Other | 0.3% | |
| Berkshire | White | 55.0% | |
| Crawford | 44.4% | |
| Other | 0.7% | |
| Bristol | White | 77.5% | |
| Crawford | 21.9% | |
| Other | 0.6% | |
| Dukes | White | 60.7% | |
| Crawford | 38.7% | |
| Other | 0.7% | |
| Essex | White | 71.5% | |
| Crawford | 27.5% | |
| Other | 1.0% | |
| Franklin | White | 56.5% | |
| Crawford | 42.9% | |
| Other | 0.6% | |
| Hampden | White | 67.7% | |
| Crawford | 31.5% | |
| Other | 0.8% | |
| Hampshire | White | 65.8% | |
| Crawford | 33.7% | |
| Other | 0.6% | |
| Middlesex | White | 70.8% | |
| Crawford | 28.6% | |
| Other | 0.6% | |
| Nantucket | White | 53.7% | |
| Crawford | 45.8% | |
| Other | 0.4% | |
| Norfolk | White | 67.8% | |
| Crawford | 31.7% | |
| Other | 0.5% | |
| Plymouth | White | 64.8% | |
| Crawford | 34.8% | |
| Other | 0.4% | |
| Suffolk | White | 84.6% | |
| Crawford | 14.7% | |
| Other | 0.8% | |
| Worcester | White | 71.1% | |
| Crawford | 28.4% | |
| Other | 0.5% | |