1964 Attorney General General Election Data Graphs - Massachusetts
by CountyData for this Contest was Contributed by on 2012-06-14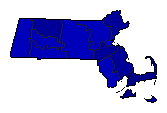
| Barnstable | Hennigan | 16.6% | |
| Brooke | 83.1% | |
| Other | 0.3% | |
| Berkshire | Hennigan | 32.1% | |
| Brooke | 67.3% | |
| Other | 0.6% | |
| Bristol | Hennigan | 38.0% | |
| Brooke | 61.7% | |
| Other | 0.4% | |
| Dukes | Hennigan | 18.8% | |
| Brooke | 80.9% | |
| Other | 0.4% | |
| Essex | Hennigan | 28.9% | |
| Brooke | 70.7% | |
| Other | 0.4% | |
| Franklin | Hennigan | 27.8% | |
| Brooke | 71.8% | |
| Other | 0.3% | |
| Hampden | Hennigan | 38.9% | |
| Brooke | 60.5% | |
| Other | 0.6% | |
| Hampshire | Hennigan | 29.9% | |
| Brooke | 69.8% | |
| Other | 0.3% | |
| Middlesex | Hennigan | 29.8% | |
| Brooke | 69.9% | |
| Other | 0.3% | |
| Nantucket | Hennigan | 21.1% | |
| Brooke | 78.4% | |
| Other | 0.5% | |
| Norfolk | Hennigan | 27.0% | |
| Brooke | 72.8% | |
| Other | 0.2% | |
| Plymouth | Hennigan | 25.2% | |
| Brooke | 74.6% | |
| Other | 0.2% | |
| Suffolk | Hennigan | 47.6% | |
| Brooke | 52.0% | |
| Other | 0.4% | |
| Worcester | Hennigan | 29.8% | |
| Brooke | 69.9% | |
| Other | 0.2% | |