1964 Presidential General Election Data Graphs - New Jersey
by County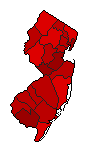
| Atlantic | Johnson | 65.3% | |
| Goldwater | 32.8% | |
| Unpledged | 0.0% | |
| Other | 1.9% | |
| Bergen | Johnson | 59.7% | |
| Goldwater | 40.1% | |
| Unpledged | 0.0% | |
| Other | 0.2% | |
| Burlington | Johnson | 64.8% | |
| Goldwater | 35.1% | |
| Unpledged | 0.0% | |
| Other | 0.1% | |
| Camden | Johnson | 67.1% | |
| Goldwater | 32.8% | |
| Unpledged | 0.0% | |
| Other | 0.2% | |
| Cape May | Johnson | 56.6% | |
| Goldwater | 43.2% | |
| Unpledged | 0.0% | |
| Other | 0.2% | |
| Cumberland | Johnson | 72.7% | |
| Goldwater | 27.3% | |
| Unpledged | 0.0% | |
| Other | 0.0% | |
| Essex | Johnson | 69.9% | |
| Goldwater | 29.3% | |
| Unpledged | 0.0% | |
| Other | 0.8% | |
| Gloucester | Johnson | 62.9% | |
| Goldwater | 37.0% | |
| Unpledged | 0.0% | |
| Other | 0.1% | |
| Hudson | Johnson | 73.5% | |
| Goldwater | 25.6% | |
| Unpledged | 0.0% | |
| Other | 0.9% | |
| Hunterdon | Johnson | 59.7% | |
| Goldwater | 40.2% | |
| Unpledged | 0.0% | |
| Other | 0.1% | |
| Mercer | Johnson | 71.2% | |
| Goldwater | 28.7% | |
| Unpledged | 0.0% | |
| Other | 0.1% | |
| Middlesex | Johnson | 70.1% | |
| Goldwater | 29.4% | |
| Unpledged | 0.0% | |
| Other | 0.5% | |
| Monmouth | Johnson | 60.7% | |
| Goldwater | 39.1% | |
| Unpledged | 0.0% | |
| Other | 0.2% | |
| Morris | Johnson | 57.2% | |
| Goldwater | 42.7% | |
| Unpledged | 0.0% | |
| Other | 0.2% | |
| Ocean | Johnson | 57.9% | |
| Goldwater | 40.8% | |
| Unpledged | 0.0% | |
| Other | 1.3% | |
| Passaic | Johnson | 63.4% | |
| Goldwater | 35.1% | |
| Unpledged | 0.0% | |
| Other | 1.5% | |
| Salem | Johnson | 67.2% | |
| Goldwater | 32.7% | |
| Unpledged | 0.0% | |
| Other | 0.1% | |
| Somerset | Johnson | 60.4% | |
| Goldwater | 39.3% | |
| Unpledged | 0.0% | |
| Other | 0.3% | |
| Sussex | Johnson | 54.8% | |
| Goldwater | 45.2% | |
| Unpledged | 0.0% | |
| Other | 0.0% | |
| Union | Johnson | 66.2% | |
| Goldwater | 33.3% | |
| Unpledged | 0.0% | |
| Other | 0.5% | |
| Warren | Johnson | 69.1% | |
| Goldwater | 30.9% | |
| Unpledged | 0.0% | |
| Other | 0.1% | |