1966 Attorney General General Election Data Graphs - Massachusetts
by CountyData for this Contest was Contributed by on 2012-08-03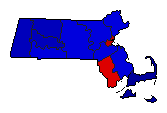
| Barnstable | Bellotti | 26.8% | |
| Richardson | 72.8% | |
| Other | 0.4% | |
| Berkshire | Bellotti | 37.0% | |
| Richardson | 62.4% | |
| Other | 0.6% | |
| Bristol | Bellotti | 53.4% | |
| Richardson | 45.6% | |
| Other | 1.0% | |
| Dukes | Bellotti | 28.6% | |
| Richardson | 71.0% | |
| Other | 0.4% | |
| Essex | Bellotti | 48.2% | |
| Richardson | 50.7% | |
| Other | 1.0% | |
| Franklin | Bellotti | 34.6% | |
| Richardson | 64.9% | |
| Other | 0.5% | |
| Hampden | Bellotti | 43.9% | |
| Richardson | 55.1% | |
| Other | 1.0% | |
| Hampshire | Bellotti | 39.2% | |
| Richardson | 60.2% | |
| Other | 0.6% | |
| Middlesex | Bellotti | 46.2% | |
| Richardson | 52.9% | |
| Other | 0.9% | |
| Nantucket | Bellotti | 28.4% | |
| Richardson | 71.3% | |
| Other | 0.3% | |
| Norfolk | Bellotti | 42.7% | |
| Richardson | 56.6% | |
| Other | 0.7% | |
| Plymouth | Bellotti | 41.4% | |
| Richardson | 58.0% | |
| Other | 0.7% | |
| Suffolk | Bellotti | 60.8% | |
| Richardson | 38.3% | |
| Other | 0.9% | |
| Worcester | Bellotti | 47.8% | |
| Richardson | 51.4% | |
| Other | 0.8% | |