1970 Attorney General General Election Data Graphs - Massachusetts
by CountyData for this Contest was Contributed by on 2012-08-08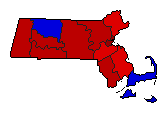
| Barnstable | Quinn | 40.8% | |
| Conn | 58.7% | |
| Other | 0.5% | |
| Berkshire | Quinn | 60.1% | |
| Conn | 39.2% | |
| Other | 0.7% | |
| Bristol | Quinn | 69.1% | |
| Conn | 30.1% | |
| Other | 0.8% | |
| Dukes | Quinn | 44.5% | |
| Conn | 54.3% | |
| Other | 1.1% | |
| Essex | Quinn | 59.9% | |
| Conn | 39.1% | |
| Other | 1.0% | |
| Franklin | Quinn | 47.5% | |
| Conn | 51.6% | |
| Other | 0.8% | |
| Hampden | Quinn | 63.0% | |
| Conn | 36.1% | |
| Other | 0.9% | |
| Hampshire | Quinn | 62.0% | |
| Conn | 37.2% | |
| Other | 0.9% | |
| Middlesex | Quinn | 60.2% | |
| Conn | 38.9% | |
| Other | 0.9% | |
| Nantucket | Quinn | 37.5% | |
| Conn | 61.2% | |
| Other | 1.3% | |
| Norfolk | Quinn | 59.7% | |
| Conn | 39.6% | |
| Other | 0.6% | |
| Plymouth | Quinn | 56.1% | |
| Conn | 43.4% | |
| Other | 0.5% | |
| Suffolk | Quinn | 74.8% | |
| Conn | 23.9% | |
| Other | 1.3% | |
| Worcester | Quinn | 65.0% | |
| Conn | 34.4% | |
| Other | 0.7% | |