1970 Gubernatorial General Election Data Graphs - Wisconsin
by CountyData for this Contest was Contributed by on 2013-04-29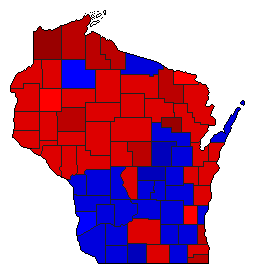
| Adams | Lucey | 53.1% | |
| Olson | 46.2% | |
| Other | 0.6% | |
| Ashland | Lucey | 66.7% | |
| Olson | 32.2% | |
| Other | 1.1% | |
| Barron | Lucey | 49.8% | |
| Olson | 49.8% | |
| Other | 0.4% | |
| Bayfield | Lucey | 64.4% | |
| Olson | 35.1% | |
| Other | 0.5% | |
| Brown | Lucey | 52.0% | |
| Olson | 46.6% | |
| Other | 1.4% | |
| Buffalo | Lucey | 52.7% | |
| Olson | 47.2% | |
| Other | 0.2% | |
| Burnett | Lucey | 58.4% | |
| Olson | 41.3% | |
| Other | 0.3% | |
| Calumet | Lucey | 50.5% | |
| Olson | 49.1% | |
| Other | 0.4% | |
| Chippewa | Lucey | 60.4% | |
| Olson | 39.0% | |
| Other | 0.6% | |
| Clark | Lucey | 53.2% | |
| Olson | 46.1% | |
| Other | 0.8% | |
| Columbia | Lucey | 42.3% | |
| Olson | 57.0% | |
| Other | 0.7% | |
| Crawford | Lucey | 43.4% | |
| Olson | 47.6% | |
| Other | 9.0% | |
| Dane | Lucey | 56.0% | |
| Olson | 42.7% | |
| Other | 1.3% | |
| Dodge | Lucey | 46.8% | |
| Olson | 52.6% | |
| Other | 0.6% | |
| Door | Lucey | 41.9% | |
| Olson | 57.7% | |
| Other | 0.4% | |
| Douglas | Lucey | 70.9% | |
| Olson | 28.4% | |
| Other | 0.6% | |
| Dunn | Lucey | 51.0% | |
| Olson | 48.5% | |
| Other | 0.4% | |
| Eau Claire | Lucey | 55.8% | |
| Olson | 43.6% | |
| Other | 0.5% | |
| Florence | Lucey | 49.9% | |
| Olson | 49.8% | |
| Other | 0.3% | |
| Fond du Lac | Lucey | 48.7% | |
| Olson | 50.4% | |
| Other | 0.9% | |
| Forest | Lucey | 62.0% | |
| Olson | 37.5% | |
| Other | 0.4% | |
| Grant | Lucey | 39.6% | |
| Olson | 58.6% | |
| Other | 1.8% | |
| Green | Lucey | 37.6% | |
| Olson | 62.0% | |
| Other | 0.4% | |
| Green Lake | Lucey | 40.1% | |
| Olson | 59.2% | |
| Other | 0.8% | |
| Iowa | Lucey | 43.1% | |
| Olson | 56.3% | |
| Other | 0.7% | |
| Iron | Lucey | 67.4% | |
| Olson | 32.2% | |
| Other | 0.5% | |
| Jackson | Lucey | 54.9% | |
| Olson | 44.8% | |
| Other | 0.3% | |
| Jefferson | Lucey | 47.1% | |
| Olson | 52.4% | |
| Other | 0.6% | |
| Juneau | Lucey | 46.4% | |
| Olson | 52.8% | |
| Other | 0.8% | |
| Kenosha | Lucey | 64.5% | |
| Olson | 34.8% | |
| Other | 0.7% | |
| Kewaunee | Lucey | 52.4% | |
| Olson | 47.2% | |
| Other | 0.4% | |
| La Crosse | Lucey | 46.0% | |
| Olson | 52.8% | |
| Other | 1.2% | |
| Lafayette | Lucey | 42.4% | |
| Olson | 57.2% | |
| Other | 0.4% | |
| Langlade | Lucey | 55.3% | |
| Olson | 44.2% | |
| Other | 0.5% | |
| Lincoln | Lucey | 50.9% | |
| Olson | 48.4% | |
| Other | 0.7% | |
| Manitowoc | Lucey | 59.2% | |
| Olson | 39.2% | |
| Other | 1.5% | |
| Marathon | Lucey | 55.3% | |
| Olson | 43.5% | |
| Other | 1.2% | |
| Marinette | Lucey | 51.7% | |
| Olson | 47.7% | |
| Other | 0.6% | |
| Marquette | Lucey | 40.7% | |
| Olson | 58.7% | |
| Other | 0.6% | |
| Menominee | Lucey | 73.5% | |
| Olson | 25.6% | |
| Other | 0.9% | |
| Milwaukee | Lucey | 63.6% | |
| Olson | 35.6% | |
| Other | 0.8% | |
| Monroe | Lucey | 45.3% | |
| Olson | 54.0% | |
| Other | 0.6% | |
| Oconto | Lucey | 51.0% | |
| Olson | 48.4% | |
| Other | 0.6% | |
| Oneida | Lucey | 50.7% | |
| Olson | 48.6% | |
| Other | 0.7% | |
| Outagamie | Lucey | 47.4% | |
| Olson | 51.7% | |
| Other | 0.9% | |
| Ozaukee | Lucey | 39.8% | |
| Olson | 59.3% | |
| Other | 0.9% | |
| Pepin | Lucey | 54.7% | |
| Olson | 44.9% | |
| Other | 0.5% | |
| Pierce | Lucey | 52.9% | |
| Olson | 47.0% | |
| Other | 0.1% | |
| Polk | Lucey | 52.3% | |
| Olson | 47.4% | |
| Other | 0.3% | |
| Portage | Lucey | 66.1% | |
| Olson | 33.1% | |
| Other | 0.8% | |
| Price | Lucey | 55.4% | |
| Olson | 44.1% | |
| Other | 0.5% | |
| Racine | Lucey | 57.8% | |
| Olson | 41.4% | |
| Other | 0.8% | |
| Richland | Lucey | 39.8% | |
| Olson | 57.9% | |
| Other | 2.3% | |
| Rock | Lucey | 51.8% | |
| Olson | 47.5% | |
| Other | 0.7% | |
| Rusk | Lucey | 57.9% | |
| Olson | 41.5% | |
| Other | 0.7% | |
| St. Croix | Lucey | 52.6% | |
| Olson | 47.2% | |
| Other | 0.2% | |
| Sauk | Lucey | 43.9% | |
| Olson | 55.1% | |
| Other | 1.0% | |
| Sawyer | Lucey | 49.6% | |
| Olson | 50.0% | |
| Other | 0.5% | |
| Shawano | Lucey | 43.6% | |
| Olson | 56.0% | |
| Other | 0.4% | |
| Sheboygan | Lucey | 51.9% | |
| Olson | 47.1% | |
| Other | 1.0% | |
| Taylor | Lucey | 50.8% | |
| Olson | 47.7% | |
| Other | 1.4% | |
| Trempealeau | Lucey | 55.1% | |
| Olson | 44.6% | |
| Other | 0.3% | |
| Vernon | Lucey | 45.9% | |
| Olson | 52.9% | |
| Other | 1.2% | |
| Vilas | Lucey | 43.6% | |
| Olson | 55.8% | |
| Other | 0.6% | |
| Walworth | Lucey | 41.5% | |
| Olson | 58.1% | |
| Other | 0.4% | |
| Washburn | Lucey | 54.8% | |
| Olson | 44.8% | |
| Other | 0.4% | |
| Washington | Lucey | 49.8% | |
| Olson | 49.5% | |
| Other | 0.7% | |
| Waukesha | Lucey | 46.8% | |
| Olson | 52.3% | |
| Other | 1.0% | |
| Waupaca | Lucey | 38.8% | |
| Olson | 60.7% | |
| Other | 0.4% | |
| Waushara | Lucey | 38.1% | |
| Olson | 61.3% | |
| Other | 0.5% | |
| Winnebago | Lucey | 46.9% | |
| Olson | 51.7% | |
| Other | 1.4% | |
| Wood | Lucey | 54.3% | |
| Olson | 45.0% | |
| Other | 0.7% | |