1972 Presidential General Election Data Graphs - Illinois
by County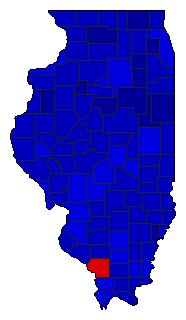
| Adams | McGovern | 30.3% | |
| Nixon | 69.5% | |
| Other | 0.2% | |
| Alexander | McGovern | 40.0% | |
| Nixon | 59.1% | |
| Other | 0.9% | |
| Bond | McGovern | 37.6% | |
| Nixon | 62.3% | |
| Other | 0.1% | |
| Boone | McGovern | 30.8% | |
| Nixon | 68.9% | |
| Other | 0.3% | |
| Brown | McGovern | 39.8% | |
| Nixon | 58.9% | |
| Other | 1.3% | |
| Bureau | McGovern | 32.4% | |
| Nixon | 67.5% | |
| Other | 0.2% | |
| Calhoun | McGovern | 43.1% | |
| Nixon | 56.5% | |
| Other | 0.4% | |
| Carroll | McGovern | 29.8% | |
| Nixon | 70.0% | |
| Other | 0.2% | |
| Cass | McGovern | 38.8% | |
| Nixon | 61.1% | |
| Other | 0.0% | |
| Champaign | McGovern | 42.2% | |
| Nixon | 57.4% | |
| Other | 0.4% | |
| Christian | McGovern | 42.7% | |
| Nixon | 57.0% | |
| Other | 0.3% | |
| Clark | McGovern | 34.2% | |
| Nixon | 65.7% | |
| Other | 0.1% | |
| Clay | McGovern | 34.9% | |
| Nixon | 64.9% | |
| Other | 0.1% | |
| Clinton | McGovern | 37.4% | |
| Nixon | 62.4% | |
| Other | 0.2% | |
| Coles | McGovern | 36.7% | |
| Nixon | 62.9% | |
| Other | 0.4% | |
| Cook | McGovern | 46.0% | |
| Nixon | 53.4% | |
| Other | 0.6% | |
| Crawford | McGovern | 34.6% | |
| Nixon | 65.3% | |
| Other | 0.1% | |
| Cumberland | McGovern | 38.9% | |
| Nixon | 60.8% | |
| Other | 0.3% | |
| DeKalb | McGovern | 39.4% | |
| Nixon | 60.3% | |
| Other | 0.3% | |
| De Witt | McGovern | 34.7% | |
| Nixon | 65.2% | |
| Other | 0.1% | |
| Douglas | McGovern | 31.2% | |
| Nixon | 68.7% | |
| Other | 0.1% | |
| DuPage | McGovern | 24.8% | |
| Nixon | 75.0% | |
| Other | 0.2% | |
| Edgar | McGovern | 35.0% | |
| Nixon | 64.7% | |
| Other | 0.3% | |
| Edwards | McGovern | 25.9% | |
| Nixon | 73.9% | |
| Other | 0.2% | |
| Effingham | McGovern | 33.6% | |
| Nixon | 66.3% | |
| Other | 0.1% | |
| Fayette | McGovern | 38.9% | |
| Nixon | 61.1% | |
| Other | 0.0% | |
| Ford | McGovern | 25.5% | |
| Nixon | 74.5% | |
| Other | 0.0% | |
| Franklin | McGovern | 45.6% | |
| Nixon | 54.0% | |
| Other | 0.3% | |
| Fulton | McGovern | 37.7% | |
| Nixon | 61.8% | |
| Other | 0.5% | |
| Gallatin | McGovern | 46.1% | |
| Nixon | 53.7% | |
| Other | 0.2% | |
| Greene | McGovern | 37.5% | |
| Nixon | 62.1% | |
| Other | 0.3% | |
| Grundy | McGovern | 29.0% | |
| Nixon | 70.7% | |
| Other | 0.3% | |
| Hamilton | McGovern | 37.9% | |
| Nixon | 61.9% | |
| Other | 0.2% | |
| Hancock | McGovern | 32.3% | |
| Nixon | 67.6% | |
| Other | 0.2% | |
| Hardin | McGovern | 37.2% | |
| Nixon | 62.5% | |
| Other | 0.2% | |
| Henderson | McGovern | 39.3% | |
| Nixon | 60.6% | |
| Other | 0.1% | |
| Henry | McGovern | 36.1% | |
| Nixon | 63.8% | |
| Other | 0.1% | |
| Iroquois | McGovern | 23.6% | |
| Nixon | 76.0% | |
| Other | 0.4% | |
| Jackson | McGovern | 51.4% | |
| Nixon | 48.4% | |
| Other | 0.2% | |
| Jasper | McGovern | 37.4% | |
| Nixon | 61.2% | |
| Other | 1.4% | |
| Jefferson | McGovern | 40.2% | |
| Nixon | 59.4% | |
| Other | 0.4% | |
| Jersey | McGovern | 39.0% | |
| Nixon | 60.7% | |
| Other | 0.3% | |
| Jo Daviess | McGovern | 36.5% | |
| Nixon | 63.4% | |
| Other | 0.2% | |
| Johnson | McGovern | 31.4% | |
| Nixon | 68.5% | |
| Other | 0.1% | |
| Kane | McGovern | 29.8% | |
| Nixon | 69.9% | |
| Other | 0.3% | |
| Kankakee | McGovern | 33.3% | |
| Nixon | 66.5% | |
| Other | 0.2% | |
| Kendall | McGovern | 21.2% | |
| Nixon | 78.7% | |
| Other | 0.2% | |
| Knox | McGovern | 34.9% | |
| Nixon | 64.7% | |
| Other | 0.4% | |
| Lake | McGovern | 33.9% | |
| Nixon | 65.8% | |
| Other | 0.2% | |
| LaSalle | McGovern | 40.6% | |
| Nixon | 59.2% | |
| Other | 0.2% | |
| Lawrence | McGovern | 34.4% | |
| Nixon | 65.4% | |
| Other | 0.2% | |
| Lee | McGovern | 30.9% | |
| Nixon | 68.7% | |
| Other | 0.4% | |
| Livingston | McGovern | 27.9% | |
| Nixon | 72.1% | |
| Other | 0.1% | |
| Logan | McGovern | 29.9% | |
| Nixon | 69.9% | |
| Other | 0.1% | |
| McDonough | McGovern | 32.7% | |
| Nixon | 67.2% | |
| Other | 0.1% | |
| McHenry | McGovern | 25.0% | |
| Nixon | 74.8% | |
| Other | 0.2% | |
| McLean | McGovern | 32.3% | |
| Nixon | 67.6% | |
| Other | 0.2% | |
| Macon | McGovern | 40.6% | |
| Nixon | 59.2% | |
| Other | 0.3% | |
| Macoupin | McGovern | 41.3% | |
| Nixon | 58.0% | |
| Other | 0.7% | |
| Madison | McGovern | 43.7% | |
| Nixon | 55.9% | |
| Other | 0.4% | |
| Marion | McGovern | 39.2% | |
| Nixon | 60.6% | |
| Other | 0.2% | |
| Marshall | McGovern | 32.4% | |
| Nixon | 67.4% | |
| Other | 0.1% | |
| Mason | McGovern | 37.1% | |
| Nixon | 62.7% | |
| Other | 0.2% | |
| Massac | McGovern | 29.7% | |
| Nixon | 70.0% | |
| Other | 0.3% | |
| Menard | McGovern | 30.2% | |
| Nixon | 69.5% | |
| Other | 0.4% | |
| Mercer | McGovern | 38.9% | |
| Nixon | 61.0% | |
| Other | 0.1% | |
| Monroe | McGovern | 31.2% | |
| Nixon | 68.4% | |
| Other | 0.3% | |
| Montgomery | McGovern | 43.1% | |
| Nixon | 56.7% | |
| Other | 0.2% | |
| Morgan | McGovern | 33.8% | |
| Nixon | 66.1% | |
| Other | 0.1% | |
| Moultrie | McGovern | 42.7% | |
| Nixon | 57.1% | |
| Other | 0.3% | |
| Ogle | McGovern | 25.9% | |
| Nixon | 73.9% | |
| Other | 0.2% | |
| Peoria | McGovern | 34.9% | |
| Nixon | 64.5% | |
| Other | 0.6% | |
| Perry | McGovern | 36.9% | |
| Nixon | 63.0% | |
| Other | 0.1% | |
| Piatt | McGovern | 32.1% | |
| Nixon | 67.7% | |
| Other | 0.2% | |
| Pike | McGovern | 39.4% | |
| Nixon | 60.2% | |
| Other | 0.4% | |
| Pope | McGovern | 34.9% | |
| Nixon | 64.9% | |
| Other | 0.2% | |
| Pulaski | McGovern | 40.1% | |
| Nixon | 59.3% | |
| Other | 0.6% | |
| Putnam | McGovern | 39.9% | |
| Nixon | 59.7% | |
| Other | 0.4% | |
| Randolph | McGovern | 39.7% | |
| Nixon | 60.2% | |
| Other | 0.1% | |
| Richland | McGovern | 31.4% | |
| Nixon | 68.4% | |
| Other | 0.2% | |
| Rock Island | McGovern | 46.3% | |
| Nixon | 53.4% | |
| Other | 0.4% | |
| St. Clair | McGovern | 47.5% | |
| Nixon | 51.5% | |
| Other | 1.0% | |
| Saline | McGovern | 40.5% | |
| Nixon | 59.3% | |
| Other | 0.2% | |
| Sangamon | McGovern | 33.4% | |
| Nixon | 65.5% | |
| Other | 1.2% | |
| Schuyler | McGovern | 33.8% | |
| Nixon | 66.0% | |
| Other | 0.1% | |
| Scott | McGovern | 33.9% | |
| Nixon | 66.0% | |
| Other | 0.1% | |
| Shelby | McGovern | 37.8% | |
| Nixon | 62.1% | |
| Other | 0.2% | |
| Stark | McGovern | 28.1% | |
| Nixon | 71.4% | |
| Other | 0.5% | |
| Stephenson | McGovern | 32.0% | |
| Nixon | 67.9% | |
| Other | 0.2% | |
| Tazewell | McGovern | 32.7% | |
| Nixon | 67.1% | |
| Other | 0.2% | |
| Union | McGovern | 40.4% | |
| Nixon | 59.4% | |
| Other | 0.2% | |
| Vermilion | McGovern | 36.6% | |
| Nixon | 63.1% | |
| Other | 0.4% | |
| Wabash | McGovern | 31.5% | |
| Nixon | 68.3% | |
| Other | 0.2% | |
| Warren | McGovern | 29.7% | |
| Nixon | 70.2% | |
| Other | 0.2% | |
| Washington | McGovern | 30.9% | |
| Nixon | 68.9% | |
| Other | 0.2% | |
| Wayne | McGovern | 30.1% | |
| Nixon | 69.8% | |
| Other | 0.1% | |
| White | McGovern | 37.7% | |
| Nixon | 62.1% | |
| Other | 0.2% | |
| Whiteside | McGovern | 31.3% | |
| Nixon | 68.4% | |
| Other | 0.3% | |
| Will | McGovern | 33.9% | |
| Nixon | 65.7% | |
| Other | 0.4% | |
| Williamson | McGovern | 39.2% | |
| Nixon | 60.0% | |
| Other | 0.8% | |
| Winnebago | McGovern | 38.3% | |
| Nixon | 61.5% | |
| Other | 0.2% | |
| Woodford | McGovern | 26.9% | |
| Nixon | 72.9% | |
| Other | 0.2% | |