1972 Presidential General Election Data Graphs - Massachusetts
by County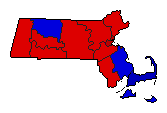
| Barnstable | McGovern | 38.1% | |
| Nixon | 61.1% | |
| Other | 0.8% | |
| Berkshire | McGovern | 53.4% | |
| Nixon | 45.8% | |
| Other | 0.8% | |
| Bristol | McGovern | 54.7% | |
| Nixon | 44.7% | |
| Other | 0.6% | |
| Dukes | McGovern | 46.1% | |
| Nixon | 53.3% | |
| Other | 0.5% | |
| Essex | McGovern | 53.0% | |
| Nixon | 46.5% | |
| Other | 0.6% | |
| Franklin | McGovern | 42.3% | |
| Nixon | 56.9% | |
| Other | 0.7% | |
| Hampden | McGovern | 52.1% | |
| Nixon | 47.3% | |
| Other | 0.6% | |
| Hampshire | McGovern | 53.3% | |
| Nixon | 45.7% | |
| Other | 1.0% | |
| Middlesex | McGovern | 55.9% | |
| Nixon | 43.6% | |
| Other | 0.5% | |
| Nantucket | McGovern | 40.0% | |
| Nixon | 59.6% | |
| Other | 0.4% | |
| Norfolk | McGovern | 52.6% | |
| Nixon | 46.9% | |
| Other | 0.5% | |
| Plymouth | McGovern | 47.3% | |
| Nixon | 52.1% | |
| Other | 0.6% | |
| Suffolk | McGovern | 65.8% | |
| Nixon | 33.7% | |
| Other | 0.5% | |
| Worcester | McGovern | 52.8% | |
| Nixon | 46.7% | |
| Other | 0.5% | |