1972 Presidential General Election Data Graphs - North Carolina
Note: The Google advertisement links below may advocate political positions that this site does not endorse.
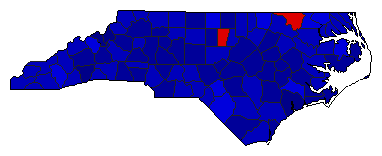
Map

AlamanceMcGovern23.1%
 
Nixon74.6%
 
Other2.3%


AlexanderMcGovern29.0%
 
Nixon69.0%
 
Other2.0%


AlleghanyMcGovern37.0%
 
Nixon61.3%
 
Other1.7%


AnsonMcGovern37.5%
 
Nixon60.9%
 
Other1.6%


AsheMcGovern36.1%
 
Nixon63.0%
 
Other1.0%


AveryMcGovern15.0%
 
Nixon84.0%
 
Other1.0%


BeaufortMcGovern29.2%
 
Nixon69.7%
 
Other1.1%


BertieMcGovern38.3%
 
Nixon60.5%
 
Other1.1%


BladenMcGovern33.9%
 
Nixon64.7%
 
Other1.4%


BrunswickMcGovern28.1%
 
Nixon69.1%
 
Other2.9%


BuncombeMcGovern27.7%
 
Nixon70.4%
 
Other1.9%


BurkeMcGovern29.6%
 
Nixon69.0%
 
Other1.5%


CabarrusMcGovern22.2%
 
Nixon76.4%
 
Other1.4%


CaldwellMcGovern26.9%
 
Nixon71.4%
 
Other1.7%


CamdenMcGovern36.8%
 
Nixon60.2%
 
Other3.0%


CarteretMcGovern24.6%
 
Nixon74.1%
 
Other1.3%


CaswellMcGovern38.4%
 
Nixon59.6%
 
Other1.9%


CatawbaMcGovern23.9%
 
Nixon74.5%
 
Other1.6%


ChathamMcGovern36.5%
 
Nixon62.1%
 
Other1.4%


CherokeeMcGovern36.5%
 
Nixon62.3%
 
Other1.2%


ChowanMcGovern32.6%
 
Nixon66.4%
 
Other1.0%


ClayMcGovern33.6%
 
Nixon65.2%
 
Other1.2%


ClevelandMcGovern26.2%
 
Nixon72.1%
 
Other1.7%


ColumbusMcGovern27.6%
 
Nixon70.6%
 
Other1.8%


CravenMcGovern20.0%
 
Nixon78.7%
 
Other1.2%


CumberlandMcGovern28.5%
 
Nixon70.5%
 
Other1.1%


CurrituckMcGovern30.3%
 
Nixon66.7%
 
Other3.0%


DareMcGovern24.0%
 
Nixon75.2%
 
Other0.8%


DavidsonMcGovern23.1%
 
Nixon74.8%
 
Other2.1%


DavieMcGovern21.3%
 
Nixon75.7%
 
Other3.0%


DuplinMcGovern28.2%
 
Nixon70.6%
 
Other1.2%


DurhamMcGovern37.4%
 
Nixon61.4%
 
Other1.3%


EdgecombeMcGovern35.2%
 
Nixon62.5%
 
Other2.3%


ForsythMcGovern30.5%
 
Nixon67.7%
 
Other1.8%


FranklinMcGovern29.5%
 
Nixon68.4%
 
Other2.2%


GastonMcGovern22.9%
 
Nixon75.8%
 
Other1.3%


GatesMcGovern47.5%
 
Nixon51.0%
 
Other1.5%


GrahamMcGovern38.0%
 
Nixon61.0%
 
Other1.0%


GranvilleMcGovern32.3%
 
Nixon66.8%
 
Other0.9%


GreeneMcGovern23.0%
 
Nixon75.7%
 
Other1.3%


GuilfordMcGovern29.2%
 
Nixon69.5%
 
Other1.3%


HalifaxMcGovern31.7%
 
Nixon66.6%
 
Other1.7%


HarnettMcGovern24.4%
 
Nixon74.6%
 
Other1.0%


HaywoodMcGovern32.9%
 
Nixon64.8%
 
Other2.3%


HendersonMcGovern17.8%
 
Nixon80.2%
 
Other2.0%


HertfordMcGovern40.3%
 
Nixon58.3%
 
Other1.4%


HokeMcGovern42.8%
 
Nixon56.2%
 
Other1.0%


HydeMcGovern26.1%
 
Nixon72.0%
 
Other1.9%


IredellMcGovern22.4%
 
Nixon73.8%
 
Other3.8%


JacksonMcGovern39.8%
 
Nixon59.1%
 
Other1.1%


JohnstonMcGovern19.4%
 
Nixon79.2%
 
Other1.4%


JonesMcGovern39.0%
 
Nixon58.9%
 
Other2.0%


LeeMcGovern25.2%
 
Nixon72.7%
 
Other2.1%


LenoirMcGovern24.5%
 
Nixon73.9%
 
Other1.6%


LincolnMcGovern36.7%
 
Nixon61.9%
 
Other1.4%


McDowellMcGovern25.8%
 
Nixon72.1%
 
Other2.2%


MaconMcGovern29.3%
 
Nixon69.2%
 
Other1.5%


MadisonMcGovern38.1%
 
Nixon61.2%
 
Other0.7%


MartinMcGovern30.2%
 
Nixon68.8%
 
Other1.0%


MecklenburgMcGovern29.8%
 
Nixon68.5%
 
Other1.7%


MitchellMcGovern15.7%
 
Nixon83.4%
 
Other0.8%


MontgomeryMcGovern32.3%
 
Nixon65.7%
 
Other2.0%


MooreMcGovern27.3%
 
Nixon70.7%
 
Other2.1%


NashMcGovern25.4%
 
Nixon71.4%
 
Other3.3%


New HanoverMcGovern23.0%
 
Nixon74.4%
 
Other2.6%


NorthamptonMcGovern51.5%
 
Nixon47.7%
 
Other0.8%


OnslowMcGovern18.8%
 
Nixon80.0%
 
Other1.2%


OrangeMcGovern51.8%
 
Nixon47.7%
 
Other0.6%


PamlicoMcGovern32.9%
 
Nixon66.1%
 
Other1.0%


PasquotankMcGovern34.2%
 
Nixon63.1%
 
Other2.8%


PenderMcGovern29.3%
 
Nixon68.9%
 
Other1.8%


PerquimansMcGovern34.8%
 
Nixon62.6%
 
Other2.6%


PersonMcGovern27.2%
 
Nixon71.9%
 
Other0.9%


PittMcGovern28.6%
 
Nixon70.4%
 
Other1.0%


PolkMcGovern30.5%
 
Nixon67.3%
 
Other2.2%


RandolphMcGovern21.7%
 
Nixon76.0%
 
Other2.3%


RichmondMcGovern37.5%
 
Nixon60.8%
 
Other1.7%


RobesonMcGovern39.0%
 
Nixon60.0%
 
Other1.0%


RockinghamMcGovern27.1%
 
Nixon71.1%
 
Other1.8%


RowanMcGovern24.2%
 
Nixon73.3%
 
Other2.5%


RutherfordMcGovern30.0%
 
Nixon68.8%
 
Other1.2%


SampsonMcGovern33.2%
 
Nixon65.8%
 
Other1.0%


ScotlandMcGovern35.4%
 
Nixon63.7%
 
Other0.9%


StanlyMcGovern29.0%
 
Nixon69.3%
 
Other1.6%


StokesMcGovern30.6%
 
Nixon66.9%
 
Other2.6%


SurryMcGovern30.4%
 
Nixon67.8%
 
Other1.8%


SwainMcGovern34.6%
 
Nixon64.4%
 
Other1.0%


TransylvaniaMcGovern27.6%
 
Nixon69.7%
 
Other2.7%


TyrrellMcGovern40.3%
 
Nixon59.3%
 
Other0.4%


UnionMcGovern27.1%
 
Nixon71.6%
 
Other1.3%


VanceMcGovern32.1%
 
Nixon66.8%
 
Other1.1%


WakeMcGovern28.2%
 
Nixon70.3%
 
Other1.5%


WarrenMcGovern38.9%
 
Nixon59.6%
 
Other1.5%


WashingtonMcGovern37.2%
 
Nixon61.6%
 
Other1.1%


WataugaMcGovern36.0%
 
Nixon62.9%
 
Other1.1%


WayneMcGovern26.4%
 
Nixon72.3%
 
Other1.3%


WilkesMcGovern25.8%
 
Nixon72.8%
 
Other1.4%


WilsonMcGovern25.2%
 
Nixon73.0%
 
Other1.7%


YadkinMcGovern18.5%
 
Nixon79.2%
 
Other2.4%


YanceyMcGovern41.9%
 
Nixon57.1%
 
Other1.0%


National DataGraph for 1972 - North Carolina Results for 1972

Login

Terms of Use - DCMA Policy - Privacy Policy and Cookies


© Dave Leip's Atlas of U.S. Elections, LLC 2019 All Rights Reserved