1972 Presidential General Election Data Graphs - South Dakota
Note: The Google advertisement links below may advocate political positions that this site does not endorse.
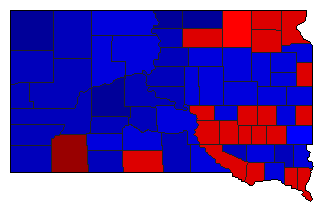
Map

AuroraMcGovern53.7%
 
Nixon46.0%
 
Other0.3%


BeadleMcGovern41.9%
 
Nixon57.8%
 
Other0.2%


BennettMcGovern37.0%
 
Nixon62.8%
 
Other0.2%


Bon HommeMcGovern52.7%
 
Nixon47.1%
 
Other0.2%


BrookingsMcGovern47.4%
 
Nixon52.3%
 
Other0.3%


BrownMcGovern49.9%
 
Nixon49.4%
 
Other0.6%


BruleMcGovern53.8%
 
Nixon45.9%
 
Other0.4%


BuffaloMcGovern55.3%
 
Nixon44.5%
 
Other0.2%


ButteMcGovern30.5%
 
Nixon68.8%
 
Other0.7%


CampbellMcGovern23.5%
 
Nixon76.1%
 
Other0.5%


Charles MixMcGovern57.0%
 
Nixon42.8%
 
Other0.2%


ClarkMcGovern45.1%
 
Nixon54.6%
 
Other0.3%


ClayMcGovern52.7%
 
Nixon47.0%
 
Other0.2%


CodingtonMcGovern48.1%
 
Nixon51.6%
 
Other0.3%


CorsonMcGovern41.2%
 
Nixon58.3%
 
Other0.5%


CusterMcGovern34.9%
 
Nixon64.5%
 
Other0.7%


DavisonMcGovern55.2%
 
Nixon44.5%
 
Other0.3%


DayMcGovern57.9%
 
Nixon41.9%
 
Other0.2%


DeuelMcGovern50.1%
 
Nixon49.6%
 
Other0.3%


DeweyMcGovern40.8%
 
Nixon58.9%
 
Other0.3%


DouglasMcGovern38.2%
 
Nixon61.7%
 
Other0.2%


EdmundsMcGovern51.2%
 
Nixon48.7%
 
Other0.1%


Fall RiverMcGovern31.7%
 
Nixon67.9%
 
Other0.5%


FaulkMcGovern49.2%
 
Nixon50.1%
 
Other0.7%


GrantMcGovern49.7%
 
Nixon50.0%
 
Other0.3%


GregoryMcGovern48.0%
 
Nixon51.6%
 
Other0.4%


HaakonMcGovern26.2%
 
Nixon73.1%
 
Other0.6%


HamlinMcGovern42.8%
 
Nixon56.9%
 
Other0.3%


HandMcGovern41.9%
 
Nixon57.9%
 
Other0.2%


HansonMcGovern53.6%
 
Nixon46.0%
 
Other0.4%


HardingMcGovern28.4%
 
Nixon71.6%


HughesMcGovern32.4%
 
Nixon67.4%
 
Other0.2%


HutchinsonMcGovern42.0%
 
Nixon57.8%
 
Other0.1%


HydeMcGovern40.2%
 
Nixon59.5%
 
Other0.3%


JacksonMcGovern30.9%
 
Nixon68.7%
 
Other0.5%


JerauldMcGovern45.5%
 
Nixon54.3%
 
Other0.2%


JonesMcGovern34.7%
 
Nixon64.4%
 
Other0.9%


KingsburyMcGovern41.2%
 
Nixon58.6%
 
Other0.2%


LakeMcGovern49.6%
 
Nixon50.1%
 
Other0.3%


LawrenceMcGovern34.5%
 
Nixon65.2%
 
Other0.3%


LincolnMcGovern44.9%
 
Nixon54.9%
 
Other0.2%


LymanMcGovern39.8%
 
Nixon60.0%
 
Other0.2%


McCookMcGovern50.3%
 
Nixon49.5%
 
Other0.2%


McPhersonMcGovern22.8%
 
Nixon76.9%
 
Other0.2%


MarshallMcGovern52.3%
 
Nixon47.7%
 
Other0.0%


MeadeMcGovern32.1%
 
Nixon67.2%
 
Other0.6%


MelletteMcGovern40.2%
 
Nixon59.2%
 
Other0.6%


MinerMcGovern55.6%
 
Nixon44.0%
 
Other0.4%


MinnehahaMcGovern49.8%
 
Nixon49.9%
 
Other0.3%


MoodyMcGovern53.3%
 
Nixon46.4%
 
Other0.3%


PenningtonMcGovern38.5%
 
Nixon61.2%
 
Other0.4%


PerkinsMcGovern34.6%
 
Nixon65.1%
 
Other0.3%


PotterMcGovern38.1%
 
Nixon61.7%
 
Other0.3%


RobertsMcGovern57.5%
 
Nixon42.3%
 
Other0.2%


SanbornMcGovern50.1%
 
Nixon49.6%
 
Other0.3%


ShannonMcGovern77.3%
 
Nixon22.1%
 
Other0.6%


SpinkMcGovern47.6%
 
Nixon52.2%
 
Other0.2%


StanleyMcGovern38.5%
 
Nixon61.0%
 
Other0.5%


SullyMcGovern34.8%
 
Nixon64.9%
 
Other0.3%


ToddMcGovern52.6%
 
Nixon46.8%
 
Other0.6%


TrippMcGovern37.2%
 
Nixon62.7%
 
Other0.0%


TurnerMcGovern39.8%
 
Nixon60.0%
 
Other0.2%


UnionMcGovern52.7%
 
Nixon46.9%
 
Other0.4%


WalworthMcGovern34.7%
 
Nixon65.1%
 
Other0.2%


WashabaughMcGovern46.3%
 
Nixon53.7%


YanktonMcGovern46.6%
 
Nixon53.1%
 
Other0.3%


ZiebachMcGovern43.4%
 
Nixon55.9%
 
Other0.7%


National DataGraph for 1972 - South Dakota Results for 1972

Login

Terms of Use - DCMA Policy - Privacy Policy and Cookies


© Dave Leip's Atlas of U.S. Elections, LLC 2019 All Rights Reserved