1972 Lt. Gubernatorial General Election Data Graphs - Washington
by CountyData for this Contest was Contributed by on 2007-01-03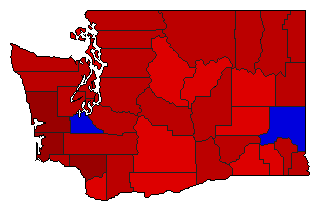
| Adams | Cherberg | 54.2% | |
| Wolf | 45.8% | |
| Asotin | Cherberg | 64.6% | |
| Wolf | 35.4% | |
| Benton | Cherberg | 60.1% | |
| Wolf | 39.9% | |
| Chelan | Cherberg | 53.7% | |
| Wolf | 46.3% | |
| Clallam | Cherberg | 67.8% | |
| Wolf | 32.2% | |
| Clark | Cherberg | 57.0% | |
| Wolf | 43.0% | |
| Columbia | Cherberg | 51.6% | |
| Wolf | 48.4% | |
| Cowlitz | Cherberg | 72.1% | |
| Wolf | 27.9% | |
| Douglas | Cherberg | 57.9% | |
| Wolf | 42.1% | |
| Ferry | Cherberg | 66.0% | |
| Wolf | 34.0% | |
| Franklin | Cherberg | 64.8% | |
| Wolf | 35.2% | |
| Garfield | Cherberg | 61.3% | |
| Wolf | 38.7% | |
| Grant | Cherberg | 60.3% | |
| Wolf | 39.7% | |
| Grays Harbor | Cherberg | 73.8% | |
| Wolf | 26.2% | |
| Island | Cherberg | 55.0% | |
| Wolf | 45.0% | |
| Jefferson | Cherberg | 68.2% | |
| Wolf | 31.8% | |
| King | Cherberg | 64.3% | |
| Wolf | 35.7% | |
| Kitsap | Cherberg | 70.0% | |
| Wolf | 30.0% | |
| Kittitas | Cherberg | 64.7% | |
| Wolf | 35.3% | |
| Klickitat | Cherberg | 59.5% | |
| Wolf | 40.5% | |
| Lewis | Cherberg | 63.3% | |
| Wolf | 36.7% | |
| Lincoln | Cherberg | 53.7% | |
| Wolf | 46.3% | |
| Mason | Cherberg | 63.7% | |
| Wolf | 36.3% | |
| Okanogan | Cherberg | 64.0% | |
| Wolf | 36.0% | |
| Pacific | Cherberg | 74.9% | |
| Wolf | 25.1% | |
| Pend Oreille | Cherberg | 63.9% | |
| Wolf | 36.1% | |
| Pierce | Cherberg | 63.5% | |
| Wolf | 36.5% | |
| San Juan | Cherberg | 52.5% | |
| Wolf | 47.5% | |
| Skagit | Cherberg | 62.7% | |
| Wolf | 37.3% | |
| Skamania | Cherberg | 64.5% | |
| Wolf | 35.5% | |
| Snohomish | Cherberg | 64.5% | |
| Wolf | 35.5% | |
| Spokane | Cherberg | 60.5% | |
| Wolf | 39.5% | |
| Stevens | Cherberg | 61.5% | |
| Wolf | 38.5% | |
| Thurston | Cherberg | 47.5% | |
| Wolf | 52.5% | |
| Wahkiakum | Cherberg | 67.2% | |
| Wolf | 32.8% | |
| Walla Walla | Cherberg | 54.9% | |
| Wolf | 45.1% | |
| Whatcom | Cherberg | 65.2% | |
| Wolf | 34.8% | |
| Whitman | Cherberg | 47.0% | |
| Wolf | 53.0% | |
| Yakima | Cherberg | 57.1% | |
| Wolf | 42.9% | |