1972 Presidential General Election Data Graphs - Wyoming
by County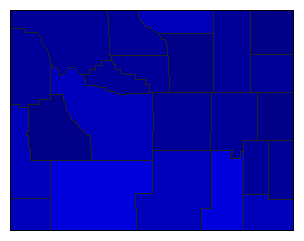
| Albany | McGovern | 40.9% | |
| Nixon | 58.9% | |
| Other | 0.2% | |
| Big Horn | McGovern | 24.4% | |
| Nixon | 75.4% | |
| Other | 0.2% | |
| Campbell | McGovern | 20.9% | |
| Nixon | 78.6% | |
| Other | 0.5% | |
| Carbon | McGovern | 36.2% | |
| Nixon | 63.7% | |
| Other | 0.2% | |
| Converse | McGovern | 22.7% | |
| Nixon | 77.1% | |
| Other | 0.2% | |
| Crook | McGovern | 16.1% | |
| Nixon | 83.4% | |
| Other | 0.5% | |
| Fremont | McGovern | 30.5% | |
| Nixon | 69.1% | |
| Other | 0.4% | |
| Goshen | McGovern | 29.3% | |
| Nixon | 70.3% | |
| Other | 0.4% | |
| Hot Springs | McGovern | 29.1% | |
| Nixon | 70.9% | |
| Johnson | McGovern | 16.5% | |
| Nixon | 83.1% | |
| Other | 0.4% | |
| Laramie | McGovern | 34.1% | |
| Nixon | 65.7% | |
| Other | 0.2% | |
| Lincoln | McGovern | 26.4% | |
| Nixon | 67.1% | |
| Other | 6.5% | |
| Natrona | McGovern | 29.3% | |
| Nixon | 70.5% | |
| Other | 0.2% | |
| Niobrara | McGovern | 18.8% | |
| Nixon | 81.0% | |
| Other | 0.2% | |
| Park | McGovern | 24.8% | |
| Nixon | 74.8% | |
| Other | 0.4% | |
| Platte | McGovern | 29.6% | |
| Nixon | 70.4% | |
| Other | 0.1% | |
| Sheridan | McGovern | 30.8% | |
| Nixon | 69.0% | |
| Other | 0.1% | |
| Sublette | McGovern | 18.4% | |
| Nixon | 81.5% | |
| Other | 0.1% | |
| Sweetwater | McGovern | 41.6% | |
| Nixon | 58.0% | |
| Other | 0.3% | |
| Teton | McGovern | 26.0% | |
| Nixon | 70.0% | |
| Other | 4.0% | |
| Uinta | McGovern | 32.3% | |
| Nixon | 67.0% | |
| Other | 0.7% | |
| Washakie | McGovern | 24.1% | |
| Nixon | 75.9% | |
| Other | 0.0% | |
| Weston | McGovern | 19.8% | |
| Nixon | 78.5% | |
| Other | 1.7% | |