1976 Presidential General Election Data Graphs - Florida
by County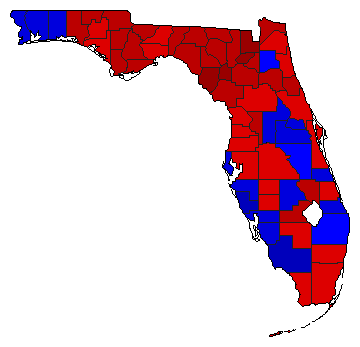
| Alachua | Carter | 62.6% | |
| Ford | 34.9% | |
| Other | 2.6% | |
| Baker | Carter | 71.2% | |
| Ford | 25.2% | |
| Other | 3.6% | |
| Bay | Carter | 50.4% | |
| Ford | 48.2% | |
| Other | 1.4% | |
| Bradford | Carter | 68.9% | |
| Ford | 29.9% | |
| Other | 1.2% | |
| Brevard | Carter | 50.3% | |
| Ford | 48.1% | |
| Other | 1.6% | |
| Broward | Carter | 51.6% | |
| Ford | 47.1% | |
| Other | 1.3% | |
| Calhoun | Carter | 67.4% | |
| Ford | 31.3% | |
| Other | 1.3% | |
| Charlotte | Carter | 44.1% | |
| Ford | 54.4% | |
| Other | 1.4% | |
| Citrus | Carter | 53.3% | |
| Ford | 45.0% | |
| Other | 1.7% | |
| Clay | Carter | 49.0% | |
| Ford | 49.4% | |
| Other | 1.6% | |
| Collier | Carter | 37.0% | |
| Ford | 61.8% | |
| Other | 1.3% | |
| Columbia | Carter | 62.1% | |
| Ford | 36.7% | |
| Other | 1.3% | |
| Desoto | Carter | 56.3% | |
| Ford | 41.5% | |
| Other | 2.2% | |
| Dixie | Carter | 78.8% | |
| Ford | 20.3% | |
| Other | 0.9% | |
| Duval | Carter | 58.0% | |
| Ford | 41.1% | |
| Other | 0.9% | |
| Escambia | Carter | 47.4% | |
| Ford | 51.4% | |
| Other | 1.2% | |
| Flagler | Carter | 61.8% | |
| Ford | 37.4% | |
| Other | 0.7% | |
| Franklin | Carter | 62.5% | |
| Ford | 35.5% | |
| Other | 2.0% | |
| Gadsden | Carter | 65.2% | |
| Ford | 33.9% | |
| Other | 1.0% | |
| Gilchrist | Carter | 76.8% | |
| Ford | 22.4% | |
| Other | 0.8% | |
| Glades | Carter | 66.7% | |
| Ford | 31.8% | |
| Other | 1.5% | |
| Gulf | Carter | 61.7% | |
| Ford | 37.0% | |
| Other | 1.3% | |
| Hamilton | Carter | 69.6% | |
| Ford | 26.9% | |
| Other | 3.5% | |
| Hardee | Carter | 52.3% | |
| Ford | 42.9% | |
| Other | 4.9% | |
| Hendry | Carter | 54.9% | |
| Ford | 43.3% | |
| Other | 1.7% | |
| Hernando | Carter | 56.2% | |
| Ford | 42.2% | |
| Other | 1.6% | |
| Highlands | Carter | 45.9% | |
| Ford | 52.9% | |
| Other | 1.3% | |
| Hillsborough | Carter | 54.0% | |
| Ford | 44.8% | |
| Other | 1.2% | |
| Holmes | Carter | 62.9% | |
| Ford | 35.7% | |
| Other | 1.4% | |
| Indian River | Carter | 45.6% | |
| Ford | 52.6% | |
| Other | 1.7% | |
| Jackson | Carter | 60.8% | |
| Ford | 37.9% | |
| Other | 1.3% | |
| Jefferson | Carter | 61.6% | |
| Ford | 36.3% | |
| Other | 2.1% | |
| Lafayette | Carter | 67.6% | |
| Ford | 31.4% | |
| Other | 1.0% | |
| Lake | Carter | 41.3% | |
| Ford | 57.4% | |
| Other | 1.3% | |
| Lee | Carter | 43.8% | |
| Ford | 54.5% | |
| Other | 1.7% | |
| Leon | Carter | 53.8% | |
| Ford | 44.4% | |
| Other | 1.8% | |
| Levy | Carter | 65.3% | |
| Ford | 31.9% | |
| Other | 2.9% | |
| Liberty | Carter | 64.0% | |
| Ford | 34.9% | |
| Other | 1.1% | |
| Madison | Carter | 63.8% | |
| Ford | 34.9% | |
| Other | 1.2% | |
| Manatee | Carter | 44.8% | |
| Ford | 53.9% | |
| Other | 1.3% | |
| Marion | Carter | 50.4% | |
| Ford | 48.0% | |
| Other | 1.6% | |
| Martin | Carter | 42.3% | |
| Ford | 56.3% | |
| Other | 1.4% | |
| Dade | Carter | 58.1% | |
| Ford | 40.5% | |
| Other | 1.5% | |
| Monroe | Carter | 56.1% | |
| Ford | 41.7% | |
| Other | 2.3% | |
| Nassau | Carter | 64.5% | |
| Ford | 34.3% | |
| Other | 1.2% | |
| Okaloosa | Carter | 42.7% | |
| Ford | 55.9% | |
| Other | 1.5% | |
| Okeechobee | Carter | 66.0% | |
| Ford | 33.1% | |
| Other | 0.9% | |
| Orange | Carter | 44.8% | |
| Ford | 54.0% | |
| Other | 1.2% | |
| Osceola | Carter | 48.6% | |
| Ford | 49.8% | |
| Other | 1.6% | |
| Palm Beach | Carter | 48.7% | |
| Ford | 49.5% | |
| Other | 1.9% | |
| Pasco | Carter | 53.7% | |
| Ford | 45.1% | |
| Other | 1.2% | |
| Pinellas | Carter | 48.0% | |
| Ford | 50.8% | |
| Other | 1.2% | |
| Polk | Carter | 51.0% | |
| Ford | 47.7% | |
| Other | 1.3% | |
| Putnam | Carter | 64.8% | |
| Ford | 34.0% | |
| Other | 1.2% | |
| St. Johns | Carter | 51.6% | |
| Ford | 46.3% | |
| Other | 2.1% | |
| St. Lucie | Carter | 51.2% | |
| Ford | 47.5% | |
| Other | 1.3% | |
| Santa Rosa | Carter | 46.1% | |
| Ford | 52.4% | |
| Other | 1.6% | |
| Sarasota | Carter | 36.8% | |
| Ford | 61.8% | |
| Other | 1.4% | |
| Seminole | Carter | 41.9% | |
| Ford | 56.9% | |
| Other | 1.2% | |
| Sumter | Carter | 66.6% | |
| Ford | 31.2% | |
| Other | 2.2% | |
| Suwannee | Carter | 63.7% | |
| Ford | 32.5% | |
| Other | 3.8% | |
| Taylor | Carter | 62.3% | |
| Ford | 36.7% | |
| Other | 1.0% | |
| Union | Carter | 72.5% | |
| Ford | 26.7% | |
| Other | 0.8% | |
| Volusia | Carter | 55.7% | |
| Ford | 42.5% | |
| Other | 1.7% | |
| Wakulla | Carter | 57.8% | |
| Ford | 38.8% | |
| Other | 3.4% | |
| Walton | Carter | 62.8% | |
| Ford | 35.4% | |
| Other | 1.9% | |
| Washington | Carter | 59.5% | |
| Ford | 38.6% | |
| Other | 2.0% | |