1976 Presidential General Election Data Graphs - Michigan
by County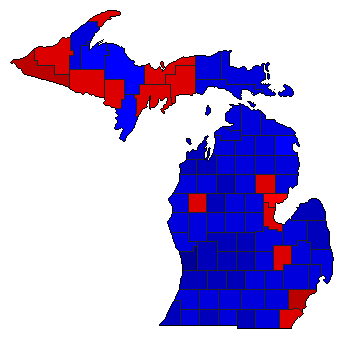
| Alcona | Carter | 46.3% | |
| Ford | 52.9% | |
| Other | 0.8% | |
| Alger | Carter | 57.2% | |
| Ford | 41.4% | |
| Other | 1.4% | |
| Allegan | Carter | 33.2% | |
| Ford | 65.6% | |
| Other | 1.2% | |
| Alpena | Carter | 49.0% | |
| Ford | 49.6% | |
| Other | 1.4% | |
| Antrim | Carter | 40.3% | |
| Ford | 58.1% | |
| Other | 1.6% | |
| Arenac | Carter | 49.7% | |
| Ford | 49.5% | |
| Other | 0.8% | |
| Baraga | Carter | 49.2% | |
| Ford | 49.5% | |
| Other | 1.3% | |
| Barry | Carter | 37.9% | |
| Ford | 60.8% | |
| Other | 1.3% | |
| Bay | Carter | 52.2% | |
| Ford | 46.6% | |
| Other | 1.1% | |
| Benzie | Carter | 37.5% | |
| Ford | 61.2% | |
| Other | 1.2% | |
| Berrien | Carter | 37.7% | |
| Ford | 61.1% | |
| Other | 1.2% | |
| Branch | Carter | 42.6% | |
| Ford | 55.7% | |
| Other | 1.7% | |
| Calhoun | Carter | 44.6% | |
| Ford | 53.8% | |
| Other | 1.6% | |
| Cass | Carter | 43.7% | |
| Ford | 55.1% | |
| Other | 1.1% | |
| Charlevoix | Carter | 42.7% | |
| Ford | 55.6% | |
| Other | 1.7% | |
| Cheboygan | Carter | 43.7% | |
| Ford | 55.1% | |
| Other | 1.2% | |
| Chippewa | Carter | 45.7% | |
| Ford | 53.3% | |
| Other | 1.0% | |
| Clare | Carter | 45.5% | |
| Ford | 53.5% | |
| Other | 1.0% | |
| Clinton | Carter | 35.4% | |
| Ford | 63.1% | |
| Other | 1.5% | |
| Crawford | Carter | 43.9% | |
| Ford | 54.8% | |
| Other | 1.3% | |
| Delta | Carter | 53.0% | |
| Ford | 45.8% | |
| Other | 1.2% | |
| Dickinson | Carter | 50.4% | |
| Ford | 48.6% | |
| Other | 1.0% | |
| Eaton | Carter | 34.8% | |
| Ford | 63.7% | |
| Other | 1.6% | |
| Emmet | Carter | 39.7% | |
| Ford | 58.5% | |
| Other | 1.8% | |
| Genesee | Carter | 51.9% | |
| Ford | 46.7% | |
| Other | 1.4% | |
| Gladwin | Carter | 49.1% | |
| Ford | 50.1% | |
| Other | 0.7% | |
| Gogebic | Carter | 61.0% | |
| Ford | 38.0% | |
| Other | 0.9% | |
| Grand Traverse | Carter | 34.3% | |
| Ford | 63.9% | |
| Other | 1.8% | |
| Gratiot | Carter | 35.9% | |
| Ford | 63.0% | |
| Other | 1.1% | |
| Hillsdale | Carter | 36.3% | |
| Ford | 62.2% | |
| Other | 1.5% | |
| Houghton | Carter | 47.1% | |
| Ford | 51.6% | |
| Other | 1.3% | |
| Huron | Carter | 37.7% | |
| Ford | 61.3% | |
| Other | 1.0% | |
| Ingham | Carter | 40.1% | |
| Ford | 55.9% | |
| Other | 3.9% | |
| Ionia | Carter | 36.3% | |
| Ford | 62.5% | |
| Other | 1.2% | |
| Iosco | Carter | 46.4% | |
| Ford | 52.4% | |
| Other | 1.2% | |
| Iron | Carter | 57.0% | |
| Ford | 41.8% | |
| Other | 1.2% | |
| Isabella | Carter | 39.7% | |
| Ford | 57.7% | |
| Other | 2.7% | |
| Jackson | Carter | 42.3% | |
| Ford | 56.2% | |
| Other | 1.5% | |
| Kalamazoo | Carter | 38.4% | |
| Ford | 59.1% | |
| Other | 2.5% | |
| Kalkaska | Carter | 45.6% | |
| Ford | 53.1% | |
| Other | 1.3% | |
| Kent | Carter | 31.3% | |
| Ford | 67.2% | |
| Other | 1.5% | |
| Keweenaw | Carter | 51.8% | |
| Ford | 47.7% | |
| Other | 0.6% | |
| Lake | Carter | 57.2% | |
| Ford | 42.0% | |
| Other | 0.8% | |
| Lapeer | Carter | 42.8% | |
| Ford | 55.6% | |
| Other | 1.6% | |
| Leelanau | Carter | 35.8% | |
| Ford | 62.3% | |
| Other | 1.9% | |
| Lenawee | Carter | 43.7% | |
| Ford | 55.0% | |
| Other | 1.3% | |
| Livingston | Carter | 38.2% | |
| Ford | 59.8% | |
| Other | 2.0% | |
| Luce | Carter | 44.0% | |
| Ford | 55.3% | |
| Other | 0.7% | |
| Mackinac | Carter | 43.6% | |
| Ford | 55.2% | |
| Other | 1.2% | |
| Macomb | Carter | 46.9% | |
| Ford | 51.2% | |
| Other | 1.9% | |
| Manistee | Carter | 44.2% | |
| Ford | 54.6% | |
| Other | 1.2% | |
| Marquette | Carter | 48.8% | |
| Ford | 49.3% | |
| Other | 1.9% | |
| Mason | Carter | 39.4% | |
| Ford | 59.2% | |
| Other | 1.4% | |
| Mecosta | Carter | 38.7% | |
| Ford | 59.6% | |
| Other | 1.7% | |
| Menominee | Carter | 49.3% | |
| Ford | 49.6% | |
| Other | 1.1% | |
| Midland | Carter | 39.7% | |
| Ford | 58.6% | |
| Other | 1.7% | |
| Missaukee | Carter | 36.1% | |
| Ford | 62.9% | |
| Other | 1.1% | |
| Monroe | Carter | 52.2% | |
| Ford | 46.4% | |
| Other | 1.4% | |
| Montcalm | Carter | 38.6% | |
| Ford | 60.4% | |
| Other | 1.0% | |
| Montmorency | Carter | 46.6% | |
| Ford | 52.0% | |
| Other | 1.4% | |
| Muskegon | Carter | 42.6% | |
| Ford | 56.1% | |
| Other | 1.3% | |
| Newaygo | Carter | 40.0% | |
| Ford | 58.8% | |
| Other | 1.2% | |
| Oakland | Carter | 39.5% | |
| Ford | 58.7% | |
| Other | 1.8% | |
| Oceana | Carter | 39.0% | |
| Ford | 59.5% | |
| Other | 1.5% | |
| Ogemaw | Carter | 51.9% | |
| Ford | 47.1% | |
| Other | 1.0% | |
| Ontonagon | Carter | 55.4% | |
| Ford | 43.9% | |
| Other | 0.7% | |
| Osceola | Carter | 36.3% | |
| Ford | 62.2% | |
| Other | 1.5% | |
| Oscoda | Carter | 41.4% | |
| Ford | 57.6% | |
| Other | 1.0% | |
| Otsego | Carter | 45.8% | |
| Ford | 53.0% | |
| Other | 1.2% | |
| Ottawa | Carter | 24.7% | |
| Ford | 74.1% | |
| Other | 1.2% | |
| Presque Isle | Carter | 48.0% | |
| Ford | 51.0% | |
| Other | 1.0% | |
| Roscommon | Carter | 43.9% | |
| Ford | 54.9% | |
| Other | 1.2% | |
| Saginaw | Carter | 43.2% | |
| Ford | 55.6% | |
| Other | 1.2% | |
| St. Clair | Carter | 45.6% | |
| Ford | 52.7% | |
| Other | 1.7% | |
| St. Joseph | Carter | 37.9% | |
| Ford | 61.1% | |
| Other | 1.1% | |
| Sanilac | Carter | 35.8% | |
| Ford | 62.9% | |
| Other | 1.3% | |
| Schoolcraft | Carter | 51.9% | |
| Ford | 46.5% | |
| Other | 1.5% | |
| Shiawassee | Carter | 44.0% | |
| Ford | 54.5% | |
| Other | 1.5% | |
| Tuscola | Carter | 39.4% | |
| Ford | 59.9% | |
| Other | 0.8% | |
| Van Buren | Carter | 42.7% | |
| Ford | 56.0% | |
| Other | 1.3% | |
| Washtenaw | Carter | 45.6% | |
| Ford | 50.9% | |
| Other | 3.6% | |
| Wayne | Carter | 60.1% | |
| Ford | 38.2% | |
| Other | 1.7% | |
| Wexford | Carter | 43.8% | |
| Ford | 55.0% | |
| Other | 1.2% | |