1976 Presidential General Election Data Graphs - Montana
by County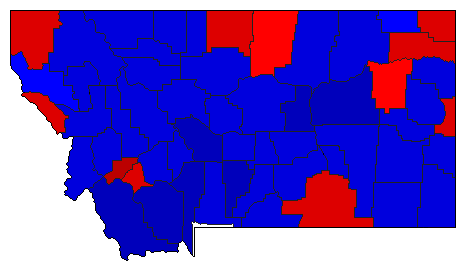
| Beaverhead | Carter | 28.6% | |
| Ford | 69.5% | |
| Other | 1.9% | |
| Big Horn | Carter | 54.0% | |
| Ford | 44.5% | |
| Other | 1.5% | |
| Blaine | Carter | 49.5% | |
| Ford | 49.3% | |
| Other | 1.2% | |
| Broadwater | Carter | 40.1% | |
| Ford | 59.0% | |
| Other | 0.9% | |
| Carbon | Carter | 45.8% | |
| Ford | 52.4% | |
| Other | 1.8% | |
| Carter | Carter | 35.4% | |
| Ford | 57.4% | |
| Other | 7.2% | |
| Cascade | Carter | 48.1% | |
| Ford | 50.1% | |
| Other | 1.8% | |
| Chouteau | Carter | 45.3% | |
| Ford | 52.4% | |
| Other | 2.4% | |
| Custer | Carter | 42.9% | |
| Ford | 55.3% | |
| Other | 1.8% | |
| Daniels | Carter | 48.6% | |
| Ford | 49.8% | |
| Other | 1.6% | |
| Dawson | Carter | 44.4% | |
| Ford | 53.2% | |
| Other | 2.4% | |
| Deer Lodge | Carter | 62.5% | |
| Ford | 35.6% | |
| Other | 1.9% | |
| Fallon | Carter | 47.1% | |
| Ford | 52.0% | |
| Other | 0.9% | |
| Fergus | Carter | 40.1% | |
| Ford | 57.7% | |
| Other | 2.2% | |
| Flathead | Carter | 41.5% | |
| Ford | 55.7% | |
| Other | 2.8% | |
| Gallatin | Carter | 35.6% | |
| Ford | 63.4% | |
| Other | 1.0% | |
| Garfield | Carter | 29.6% | |
| Ford | 67.8% | |
| Other | 2.6% | |
| Glacier | Carter | 47.1% | |
| Ford | 50.8% | |
| Other | 2.1% | |
| Golden Valley | Carter | 44.8% | |
| Ford | 53.1% | |
| Other | 2.1% | |
| Granite | Carter | 40.0% | |
| Ford | 58.6% | |
| Other | 1.3% | |
| Hill | Carter | 53.4% | |
| Ford | 45.1% | |
| Other | 1.5% | |
| Jefferson | Carter | 45.6% | |
| Ford | 52.3% | |
| Other | 2.1% | |
| Judith Basin | Carter | 47.8% | |
| Ford | 50.1% | |
| Other | 2.0% | |
| Lake | Carter | 45.1% | |
| Ford | 52.8% | |
| Other | 2.1% | |
| Lewis and Clark | Carter | 43.8% | |
| Ford | 54.8% | |
| Other | 1.3% | |
| Liberty | Carter | 43.5% | |
| Ford | 54.9% | |
| Other | 1.6% | |
| Lincoln | Carter | 50.1% | |
| Ford | 48.0% | |
| Other | 1.9% | |
| McCone | Carter | 50.0% | |
| Ford | 48.7% | |
| Other | 1.3% | |
| Madison | Carter | 33.3% | |
| Ford | 64.7% | |
| Other | 2.0% | |
| Meagher | Carter | 38.8% | |
| Ford | 60.2% | |
| Other | 1.1% | |
| Mineral | Carter | 54.1% | |
| Ford | 44.8% | |
| Other | 1.1% | |
| Missoula | Carter | 47.4% | |
| Ford | 51.4% | |
| Other | 1.2% | |
| Musselshell | Carter | 44.6% | |
| Ford | 54.1% | |
| Other | 1.3% | |
| Park | Carter | 41.2% | |
| Ford | 57.2% | |
| Other | 1.7% | |
| Petroleum | Carter | 33.2% | |
| Ford | 63.7% | |
| Other | 3.0% | |
| Phillips | Carter | 44.9% | |
| Ford | 54.2% | |
| Other | 0.9% | |
| Pondera | Carter | 44.9% | |
| Ford | 52.9% | |
| Other | 2.3% | |
| Powder River | Carter | 34.7% | |
| Ford | 55.3% | |
| Other | 10.0% | |
| Powell | Carter | 44.1% | |
| Ford | 54.6% | |
| Other | 1.3% | |
| Prairie | Carter | 40.7% | |
| Ford | 58.6% | |
| Other | 0.7% | |
| Ravalli | Carter | 40.3% | |
| Ford | 56.3% | |
| Other | 3.4% | |
| Richland | Carter | 46.0% | |
| Ford | 51.3% | |
| Other | 2.7% | |
| Roosevelt | Carter | 52.5% | |
| Ford | 46.4% | |
| Other | 1.1% | |
| Rosebud | Carter | 47.0% | |
| Ford | 51.2% | |
| Other | 1.8% | |
| Sanders | Carter | 48.2% | |
| Ford | 48.6% | |
| Other | 3.2% | |
| Sheridan | Carter | 57.5% | |
| Ford | 41.0% | |
| Other | 1.5% | |
| Silver Bow | Carter | 59.5% | |
| Ford | 39.3% | |
| Other | 1.2% | |
| Stillwater | Carter | 43.4% | |
| Ford | 54.9% | |
| Other | 1.7% | |
| Sweet Grass | Carter | 30.3% | |
| Ford | 68.4% | |
| Other | 1.3% | |
| Teton | Carter | 45.0% | |
| Ford | 51.7% | |
| Other | 3.3% | |
| Toole | Carter | 41.5% | |
| Ford | 56.4% | |
| Other | 2.1% | |
| Treasure | Carter | 42.4% | |
| Ford | 55.9% | |
| Other | 1.8% | |
| Valley | Carter | 47.4% | |
| Ford | 50.8% | |
| Other | 1.8% | |
| Wheatland | Carter | 40.5% | |
| Ford | 57.2% | |
| Other | 2.3% | |
| Wibaux | Carter | 50.9% | |
| Ford | 44.6% | |
| Other | 4.5% | |
| Yellowstone | Carter | 41.5% | |
| Ford | 57.1% | |
| Other | 1.3% | |