1976 Presidential General Election Data Graphs - Pennsylvania
by County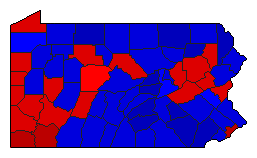
| Adams | Carter | 41.1% | |
| Ford | 56.9% | |
| Other | 2.0% | |
| Allegheny | Carter | 50.7% | |
| Ford | 46.8% | |
| Other | 2.5% | |
| Armstrong | Carter | 52.3% | |
| Ford | 46.1% | |
| Other | 1.7% | |
| Beaver | Carter | 56.8% | |
| Ford | 41.4% | |
| Other | 1.8% | |
| Bedford | Carter | 41.2% | |
| Ford | 58.0% | |
| Other | 0.8% | |
| Berks | Carter | 47.4% | |
| Ford | 50.6% | |
| Other | 2.0% | |
| Blair | Carter | 38.8% | |
| Ford | 59.7% | |
| Other | 1.4% | |
| Bradford | Carter | 37.6% | |
| Ford | 61.1% | |
| Other | 1.3% | |
| Bucks | Carter | 47.3% | |
| Ford | 50.7% | |
| Other | 2.0% | |
| Butler | Carter | 45.0% | |
| Ford | 52.5% | |
| Other | 2.4% | |
| Cambria | Carter | 53.8% | |
| Ford | 45.0% | |
| Other | 1.2% | |
| Cameron | Carter | 44.3% | |
| Ford | 54.3% | |
| Other | 1.4% | |
| Carbon | Carter | 54.0% | |
| Ford | 44.5% | |
| Other | 1.5% | |
| Centre | Carter | 44.2% | |
| Ford | 52.4% | |
| Other | 3.4% | |
| Chester | Carter | 38.1% | |
| Ford | 60.4% | |
| Other | 1.5% | |
| Clarion | Carter | 43.3% | |
| Ford | 55.0% | |
| Other | 1.7% | |
| Clearfield | Carter | 49.5% | |
| Ford | 49.2% | |
| Other | 1.2% | |
| Clinton | Carter | 52.0% | |
| Ford | 46.6% | |
| Other | 1.4% | |
| Columbia | Carter | 50.4% | |
| Ford | 48.1% | |
| Other | 1.5% | |
| Crawford | Carter | 48.1% | |
| Ford | 50.0% | |
| Other | 2.0% | |
| Cumberland | Carter | 35.8% | |
| Ford | 62.2% | |
| Other | 2.0% | |
| Dauphin | Carter | 41.3% | |
| Ford | 56.3% | |
| Other | 2.4% | |
| Delaware | Carter | 43.3% | |
| Ford | 54.9% | |
| Other | 1.8% | |
| Elk | Carter | 51.2% | |
| Ford | 47.0% | |
| Other | 1.8% | |
| Erie | Carter | 51.6% | |
| Ford | 46.2% | |
| Other | 2.2% | |
| Fayette | Carter | 60.5% | |
| Ford | 37.6% | |
| Other | 1.9% | |
| Forest | Carter | 46.5% | |
| Ford | 51.9% | |
| Other | 1.6% | |
| Franklin | Carter | 41.4% | |
| Ford | 56.5% | |
| Other | 2.1% | |
| Fulton | Carter | 42.9% | |
| Ford | 54.8% | |
| Other | 2.4% | |
| Greene | Carter | 61.7% | |
| Ford | 37.2% | |
| Other | 1.1% | |
| Huntingdon | Carter | 40.2% | |
| Ford | 58.3% | |
| Other | 1.6% | |
| Indiana | Carter | 47.3% | |
| Ford | 51.0% | |
| Other | 1.7% | |
| Jefferson | Carter | 43.5% | |
| Ford | 55.1% | |
| Other | 1.4% | |
| Juniata | Carter | 43.1% | |
| Ford | 55.4% | |
| Other | 1.5% | |
| Lackawanna | Carter | 56.1% | |
| Ford | 42.2% | |
| Other | 1.7% | |
| Lancaster | Carter | 32.4% | |
| Ford | 65.7% | |
| Other | 1.9% | |
| Lawrence | Carter | 54.7% | |
| Ford | 43.5% | |
| Other | 1.8% | |
| Lebanon | Carter | 35.4% | |
| Ford | 62.6% | |
| Other | 2.0% | |
| Lehigh | Carter | 48.9% | |
| Ford | 49.2% | |
| Other | 1.9% | |
| Luzerne | Carter | 54.9% | |
| Ford | 44.2% | |
| Other | 1.0% | |
| Lycoming | Carter | 44.3% | |
| Ford | 53.8% | |
| Other | 1.9% | |
| McKean | Carter | 38.0% | |
| Ford | 60.9% | |
| Other | 1.2% | |
| Mercer | Carter | 51.9% | |
| Ford | 46.6% | |
| Other | 1.5% | |
| Mifflin | Carter | 44.0% | |
| Ford | 54.6% | |
| Other | 1.4% | |
| Monroe | Carter | 47.3% | |
| Ford | 50.7% | |
| Other | 1.9% | |
| Montgomery | Carter | 41.2% | |
| Ford | 56.9% | |
| Other | 1.8% | |
| Montour | Carter | 44.9% | |
| Ford | 53.6% | |
| Other | 1.5% | |
| Northampton | Carter | 55.2% | |
| Ford | 42.8% | |
| Other | 2.0% | |
| Northumberland | Carter | 48.7% | |
| Ford | 49.6% | |
| Other | 1.7% | |
| Perry | Carter | 37.4% | |
| Ford | 60.5% | |
| Other | 2.1% | |
| Philadelphia | Carter | 66.3% | |
| Ford | 32.0% | |
| Other | 1.7% | |
| Pike | Carter | 38.8% | |
| Ford | 59.3% | |
| Other | 1.8% | |
| Potter | Carter | 43.3% | |
| Ford | 55.6% | |
| Other | 1.2% | |
| Schuylkill | Carter | 50.6% | |
| Ford | 47.7% | |
| Other | 1.6% | |
| Snyder | Carter | 31.2% | |
| Ford | 66.0% | |
| Other | 2.8% | |
| Somerset | Carter | 45.3% | |
| Ford | 53.8% | |
| Other | 0.9% | |
| Sullivan | Carter | 45.6% | |
| Ford | 53.7% | |
| Other | 0.7% | |
| Susquehanna | Carter | 41.4% | |
| Ford | 56.7% | |
| Other | 1.9% | |
| Tioga | Carter | 40.2% | |
| Ford | 58.4% | |
| Other | 1.3% | |
| Union | Carter | 34.4% | |
| Ford | 63.7% | |
| Other | 1.9% | |
| Venango | Carter | 40.6% | |
| Ford | 57.6% | |
| Other | 1.8% | |
| Warren | Carter | 45.8% | |
| Ford | 52.6% | |
| Other | 1.5% | |
| Washington | Carter | 59.2% | |
| Ford | 39.4% | |
| Other | 1.3% | |
| Wayne | Carter | 34.5% | |
| Ford | 63.5% | |
| Other | 2.1% | |
| Westmoreland | Carter | 54.5% | |
| Ford | 43.5% | |
| Other | 2.0% | |
| Wyoming | Carter | 38.4% | |
| Ford | 60.3% | |
| Other | 1.3% | |
| York | Carter | 41.3% | |
| Ford | 56.9% | |
| Other | 1.8% | |