1976 Presidential General Election Data Graphs - Colorado
by County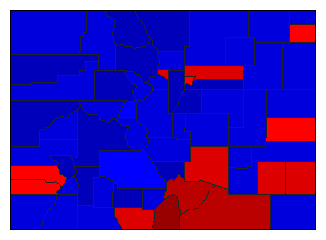
| Adams | Carter | 51.9% | |
| Ford | 45.3% | |
| Other | 2.8% | |
| Alamosa | Carter | 42.2% | |
| Ford | 53.5% | |
| Other | 4.2% | |
| Arapahoe | Carter | 33.8% | |
| Ford | 63.5% | |
| Other | 2.7% | |
| Archuleta | Carter | 44.1% | |
| Ford | 53.6% | |
| Other | 2.2% | |
| Baca | Carter | 46.4% | |
| Ford | 52.0% | |
| Other | 1.6% | |
| Bent | Carter | 51.1% | |
| Ford | 46.6% | |
| Other | 2.3% | |
| Boulder | Carter | 41.0% | |
| Ford | 52.7% | |
| Other | 6.3% | |
| Chaffee | Carter | 40.0% | |
| Ford | 56.7% | |
| Other | 3.4% | |
| Cheyenne | Carter | 49.3% | |
| Ford | 48.1% | |
| Other | 2.5% | |
| Clear Creek | Carter | 40.1% | |
| Ford | 55.4% | |
| Other | 4.6% | |
| Conejos | Carter | 53.2% | |
| Ford | 44.6% | |
| Other | 2.2% | |
| Costilla | Carter | 71.0% | |
| Ford | 27.0% | |
| Other | 2.0% | |
| Crowley | Carter | 43.9% | |
| Ford | 54.9% | |
| Other | 1.2% | |
| Custer | Carter | 32.9% | |
| Ford | 62.4% | |
| Other | 4.7% | |
| Delta | Carter | 38.2% | |
| Ford | 58.8% | |
| Other | 3.0% | |
| Denver | Carter | 49.5% | |
| Ford | 46.7% | |
| Other | 3.8% | |
| Dolores | Carter | 49.7% | |
| Ford | 45.6% | |
| Other | 4.7% | |
| Douglas | Carter | 31.7% | |
| Ford | 65.5% | |
| Other | 2.7% | |
| Eagle | Carter | 32.5% | |
| Ford | 64.2% | |
| Other | 3.3% | |
| Elbert | Carter | 44.0% | |
| Ford | 52.7% | |
| Other | 3.3% | |
| El Paso | Carter | 38.2% | |
| Ford | 59.1% | |
| Other | 2.7% | |
| Fremont | Carter | 45.4% | |
| Ford | 52.4% | |
| Other | 2.2% | |
| Garfield | Carter | 36.3% | |
| Ford | 59.7% | |
| Other | 4.0% | |
| Gilpin | Carter | 51.4% | |
| Ford | 41.2% | |
| Other | 7.4% | |
| Grand | Carter | 33.0% | |
| Ford | 61.8% | |
| Other | 5.2% | |
| Gunnison | Carter | 30.1% | |
| Ford | 61.9% | |
| Other | 8.0% | |
| Hinsdale | Carter | 29.2% | |
| Ford | 66.5% | |
| Other | 4.2% | |
| Huerfano | Carter | 61.0% | |
| Ford | 37.3% | |
| Other | 1.6% | |
| Jackson | Carter | 37.3% | |
| Ford | 60.8% | |
| Other | 1.9% | |
| Jefferson | Carter | 36.6% | |
| Ford | 60.4% | |
| Other | 2.9% | |
| Kiowa | Carter | 46.5% | |
| Ford | 52.6% | |
| Other | 0.9% | |
| Kit Carson | Carter | 45.6% | |
| Ford | 52.3% | |
| Other | 2.1% | |
| Lake | Carter | 47.2% | |
| Ford | 48.0% | |
| Other | 4.7% | |
| La Plata | Carter | 36.4% | |
| Ford | 59.0% | |
| Other | 4.5% | |
| Larimer | Carter | 35.9% | |
| Ford | 60.7% | |
| Other | 3.4% | |
| Las Animas | Carter | 62.1% | |
| Ford | 36.4% | |
| Other | 1.4% | |
| Lincoln | Carter | 44.4% | |
| Ford | 53.5% | |
| Other | 2.2% | |
| Logan | Carter | 44.4% | |
| Ford | 53.3% | |
| Other | 2.3% | |
| Mesa | Carter | 32.2% | |
| Ford | 65.4% | |
| Other | 2.4% | |
| Mineral | Carter | 39.5% | |
| Ford | 55.6% | |
| Other | 5.0% | |
| Moffat | Carter | 38.5% | |
| Ford | 55.7% | |
| Other | 5.8% | |
| Montezuma | Carter | 38.5% | |
| Ford | 58.0% | |
| Other | 3.5% | |
| Montrose | Carter | 38.2% | |
| Ford | 58.4% | |
| Other | 3.4% | |
| Morgan | Carter | 44.0% | |
| Ford | 53.3% | |
| Other | 2.6% | |
| Otero | Carter | 46.2% | |
| Ford | 51.5% | |
| Other | 2.3% | |
| Ouray | Carter | 32.3% | |
| Ford | 62.5% | |
| Other | 5.2% | |
| Park | Carter | 39.6% | |
| Ford | 55.2% | |
| Other | 5.2% | |
| Phillips | Carter | 49.4% | |
| Ford | 48.1% | |
| Other | 2.4% | |
| Pitkin | Carter | 39.8% | |
| Ford | 53.6% | |
| Other | 6.6% | |
| Prowers | Carter | 51.2% | |
| Ford | 46.1% | |
| Other | 2.7% | |
| Pueblo | Carter | 57.2% | |
| Ford | 41.0% | |
| Other | 1.7% | |
| Rio Blanco | Carter | 29.3% | |
| Ford | 67.2% | |
| Other | 3.5% | |
| Rio Grande | Carter | 35.0% | |
| Ford | 62.4% | |
| Other | 2.6% | |
| Routt | Carter | 40.9% | |
| Ford | 54.1% | |
| Other | 5.0% | |
| Saguache | Carter | 47.9% | |
| Ford | 49.5% | |
| Other | 2.6% | |
| San Juan | Carter | 40.6% | |
| Ford | 53.8% | |
| Other | 5.6% | |
| San Miguel | Carter | 47.5% | |
| Ford | 43.8% | |
| Other | 8.7% | |
| Sedgwick | Carter | 45.5% | |
| Ford | 53.1% | |
| Other | 1.5% | |
| Summit | Carter | 34.6% | |
| Ford | 58.2% | |
| Other | 7.2% | |
| Teller | Carter | 39.1% | |
| Ford | 55.9% | |
| Other | 5.0% | |
| Washington | Carter | 44.3% | |
| Ford | 52.6% | |
| Other | 3.1% | |
| Weld | Carter | 41.6% | |
| Ford | 55.4% | |
| Other | 3.1% | |
| Yuma | Carter | 45.0% | |
| Ford | 52.2% | |
| Other | 2.8% | |