1978 Gubernatorial Republican Primary Election Data Graphs - Nevada
Note: The Google advertisement links below may advocate political positions that this site does not endorse.
Data for this Contest was Contributed by on 2014-08-13
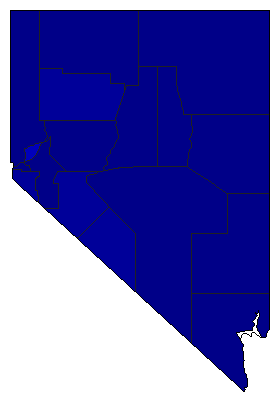
Map

ChurchillMylan3.1%
 
List81.6%
 
Allen6.4%
 
Other9.0%


ClarkMylan1.6%
 
List82.1%
 
Allen7.5%
 
Other8.7%


DouglasMylan4.1%
 
List78.3%
 
Allen5.1%
 
Other12.4%


ElkoMylan4.0%
 
List87.9%
 
Allen3.5%
 
Other4.7%


EsmeraldaMylan8.2%
 
List77.6%
 
Allen7.1%
 
Other7.1%


EurekaMylan2.5%
 
List84.4%
 
Allen4.0%
 
Other9.0%


HumboldtMylan2.6%
 
List86.6%
 
Allen5.4%
 
Other5.4%


LanderMylan2.4%
 
List81.7%
 
Allen7.0%
 
Other8.9%


LincolnMylan4.0%
 
List83.4%
 
Allen6.1%
 
Other6.5%


LyonMylan2.6%
 
List83.1%
 
Allen6.2%
 
Other8.2%


MineralMylan9.6%
 
List76.0%
 
Allen6.6%
 
Other7.8%


NyeMylan5.2%
 
List80.5%
 
Allen7.8%
 
Other6.6%


PershingMylan6.8%
 
List70.8%
 
Allen9.3%
 
Other13.1%


StoreyMylan12.5%
 
List60.9%
 
Allen12.5%
 
Other14.1%


WashoeMylan3.5%
 
List83.0%
 
Allen5.0%
 
Other8.5%


White PineMylan3.8%
 
List85.1%
 
Allen4.1%
 
Other7.0%


City

Carson CityMylan3.3%
 
List84.0%
 
Allen5.2%
 
Other7.4%


National DataGraph for 1978 - Nevada Results for 1978

Login

Terms of Use - DCMA Policy - Privacy Policy and Cookies


© Dave Leip's Atlas of U.S. Elections, LLC 2019 All Rights Reserved