1980 Senatorial General Election Data Graphs - North Carolina
Note: The Google advertisement links below may advocate political positions that this site does not endorse.
Data for this Contest was Contributed by on 2018-10-12
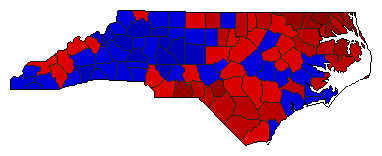
Map

AlamanceMorgan41.7%
 
East57.6%
 
Other0.7%


AlexanderMorgan40.3%
 
East59.6%
 
Other0.1%


AlleghanyMorgan54.0%
 
East45.9%
 
Other0.1%


AnsonMorgan73.7%
 
East26.1%
 
Other0.2%


AsheMorgan45.3%
 
East54.5%
 
Other0.2%


AveryMorgan31.8%
 
East67.8%
 
Other0.4%


BeaufortMorgan49.5%
 
East50.3%
 
Other0.2%


BertieMorgan69.7%
 
East29.8%
 
Other0.5%


BladenMorgan67.7%
 
East31.3%
 
Other1.0%


BrunswickMorgan51.3%
 
East47.9%
 
Other0.8%


BuncombeMorgan48.0%
 
East51.2%
 
Other0.8%


BurkeMorgan43.5%
 
East56.2%
 
Other0.3%


CabarrusMorgan38.9%
 
East60.5%
 
Other0.6%


CaldwellMorgan38.6%
 
East61.1%
 
Other0.3%


CamdenMorgan74.2%
 
East25.5%
 
Other0.3%


CarteretMorgan47.4%
 
East52.1%
 
Other0.5%


CaswellMorgan63.4%
 
East36.2%
 
Other0.4%


CatawbaMorgan37.2%
 
East62.5%
 
Other0.3%


ChathamMorgan56.6%
 
East42.7%
 
Other0.7%


CherokeeMorgan48.0%
 
East51.2%
 
Other0.8%


ChowanMorgan66.5%
 
East32.3%
 
Other1.2%


ClayMorgan42.8%
 
East56.9%
 
Other0.3%


ClevelandMorgan48.4%
 
East51.1%
 
Other0.5%


ColumbusMorgan62.4%
 
East36.9%
 
Other0.6%


CravenMorgan49.2%
 
East50.3%
 
Other0.6%


CumberlandMorgan52.1%
 
East47.0%
 
Other0.9%


CurrituckMorgan73.1%
 
East26.6%
 
Other0.2%


DareMorgan62.8%
 
East36.5%
 
Other0.7%


DavidsonMorgan39.1%
 
East60.3%
 
Other0.6%


DavieMorgan35.8%
 
East63.9%
 
Other0.3%


DuplinMorgan59.2%
 
East40.7%
 
Other0.1%


DurhamMorgan57.2%
 
East41.3%
 
Other1.5%


EdgecombeMorgan58.8%
 
East40.9%
 
Other0.3%


ForsythMorgan47.9%
 
East51.3%
 
Other0.8%


FranklinMorgan57.7%
 
East42.1%
 
Other0.2%


GastonMorgan40.6%
 
East58.8%
 
Other0.6%


GatesMorgan87.6%
 
East12.2%
 
Other0.2%


GrahamMorgan48.3%
 
East51.5%
 
Other0.2%


GranvilleMorgan62.0%
 
East37.7%
 
Other0.3%


GreeneMorgan59.2%
 
East40.7%
 
Other0.1%


GuilfordMorgan46.1%
 
East53.1%
 
Other0.8%


HalifaxMorgan59.0%
 
East40.8%
 
Other0.2%


HarnettMorgan59.9%
 
East39.7%
 
Other0.3%


HaywoodMorgan55.0%
 
East44.8%
 
Other0.2%


HendersonMorgan38.3%
 
East61.0%
 
Other0.6%


HertfordMorgan75.5%
 
East23.9%
 
Other0.6%


HokeMorgan73.2%
 
East26.5%
 
Other0.3%


HydeMorgan64.3%
 
East35.3%
 
Other0.3%


IredellMorgan43.8%
 
East55.8%
 
Other0.4%


JacksonMorgan55.2%
 
East44.1%
 
Other0.7%


JohnstonMorgan48.1%
 
East51.5%
 
Other0.4%


JonesMorgan61.6%
 
East38.3%
 
Other0.0%


LeeMorgan49.4%
 
East49.9%
 
Other0.7%


LenoirMorgan46.8%
 
East52.9%
 
Other0.2%


LincolnMorgan47.1%
 
East52.6%
 
Other0.3%


McDowellMorgan45.6%
 
East54.0%
 
Other0.4%


MaconMorgan48.6%
 
East51.0%
 
Other0.3%


MadisonMorgan57.5%
 
East41.8%
 
Other0.7%


MartinMorgan65.5%
 
East34.1%
 
Other0.4%


MecklenburgMorgan50.3%
 
East48.7%
 
Other1.0%


MitchellMorgan29.7%
 
East70.0%
 
Other0.3%


MontgomeryMorgan54.9%
 
East45.0%
 
Other0.1%


MooreMorgan45.0%
 
East54.7%
 
Other0.3%


NashMorgan43.6%
 
East56.0%
 
Other0.4%


New HanoverMorgan46.2%
 
East52.9%
 
Other0.9%


NorthamptonMorgan76.3%
 
East23.4%
 
Other0.4%


OnslowMorgan43.9%
 
East55.2%
 
Other0.9%


OrangeMorgan63.7%
 
East34.2%
 
Other2.1%


PamlicoMorgan61.5%
 
East38.2%
 
Other0.3%


PasquotankMorgan65.7%
 
East33.6%
 
Other0.7%


PenderMorgan60.3%
 
East39.6%
 
Other0.2%


PerquimansMorgan73.3%
 
East26.1%
 
Other0.6%


PersonMorgan47.9%
 
East51.0%
 
Other1.1%


PittMorgan51.8%
 
East47.9%
 
Other0.3%


PolkMorgan48.0%
 
East51.3%
 
Other0.7%


RandolphMorgan35.4%
 
East64.1%
 
Other0.5%


RichmondMorgan62.1%
 
East37.4%
 
Other0.5%


RobesonMorgan68.9%
 
East30.3%
 
Other0.7%


RockinghamMorgan51.1%
 
East48.2%
 
Other0.7%


RowanMorgan38.1%
 
East61.2%
 
Other0.7%


RutherfordMorgan48.8%
 
East50.5%
 
Other0.7%


SampsonMorgan55.9%
 
East43.9%
 
Other0.2%


ScotlandMorgan65.1%
 
East34.3%
 
Other0.6%


StanlyMorgan42.7%
 
East57.0%
 
Other0.3%


StokesMorgan44.8%
 
East54.9%
 
Other0.3%


SurryMorgan48.1%
 
East51.5%
 
Other0.4%


SwainMorgan55.6%
 
East44.1%
 
Other0.4%


TransylvaniaMorgan46.3%
 
East52.7%
 
Other1.0%


TyrrellMorgan71.6%
 
East28.2%
 
Other0.2%


UnionMorgan51.8%
 
East47.9%
 
Other0.3%


VanceMorgan56.5%
 
East42.9%
 
Other0.5%


WakeMorgan52.2%
 
East46.7%
 
Other1.1%


WarrenMorgan67.2%
 
East32.4%
 
Other0.3%


WashingtonMorgan62.0%
 
East38.0%
 
Other0.1%


WataugaMorgan45.6%
 
East52.4%
 
Other1.9%


WayneMorgan46.0%
 
East53.4%
 
Other0.6%


WilkesMorgan37.2%
 
East62.3%
 
Other0.4%


WilsonMorgan51.7%
 
East47.6%
 
Other0.7%


YadkinMorgan34.7%
 
East65.1%
 
Other0.1%


YanceyMorgan54.4%
 
East45.2%
 
Other0.4%


National DataGraph for 1980 - North Carolina Results for 1980

Login

Terms of Use - DCMA Policy - Privacy Policy and Cookies


© Dave Leip's Atlas of U.S. Elections, LLC 2019 All Rights Reserved