1980 Senatorial General Election Data Graphs - Pennsylvania
Note: The Google advertisement links below may advocate political positions that this site does not endorse.
Data for this Contest was Contributed by on 2007-06-08
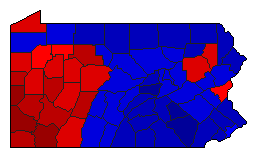
Map

AdamsFlaherty37.4%
 
Specter61.2%
 
Other1.4%


AlleghenyFlaherty61.5%
 
Specter36.5%
 
Other2.0%


ArmstrongFlaherty63.0%
 
Specter36.5%
 
Other0.5%


BeaverFlaherty72.8%
 
Specter26.4%
 
Other0.8%


BedfordFlaherty40.6%
 
Specter59.0%
 
Other0.4%


BerksFlaherty42.3%
 
Specter56.5%
 
Other1.3%


BlairFlaherty48.0%
 
Specter51.1%
 
Other0.9%


BradfordFlaherty34.6%
 
Specter63.8%
 
Other1.5%


BucksFlaherty36.2%
 
Specter62.3%
 
Other1.5%


ButlerFlaherty59.9%
 
Specter38.9%
 
Other1.2%


CambriaFlaherty65.1%
 
Specter34.3%
 
Other0.6%


CameronFlaherty45.4%
 
Specter53.7%
 
Other0.9%


CarbonFlaherty48.6%
 
Specter50.1%
 
Other1.3%


CentreFlaherty46.5%
 
Specter50.9%
 
Other2.6%


ChesterFlaherty29.9%
 
Specter68.7%
 
Other1.3%


ClarionFlaherty56.6%
 
Specter42.5%
 
Other0.9%


ClearfieldFlaherty53.1%
 
Specter46.2%
 
Other0.7%


ClintonFlaherty44.5%
 
Specter54.1%
 
Other1.4%


ColumbiaFlaherty45.5%
 
Specter53.5%
 
Other1.0%


CrawfordFlaherty47.0%
 
Specter51.4%
 
Other1.6%


CumberlandFlaherty32.7%
 
Specter66.1%
 
Other1.2%


DauphinFlaherty35.5%
 
Specter63.3%
 
Other1.2%


DelawareFlaherty36.5%
 
Specter62.2%
 
Other1.3%


ElkFlaherty60.8%
 
Specter38.5%
 
Other0.6%


ErieFlaherty58.5%
 
Specter39.5%
 
Other2.0%


FayetteFlaherty71.1%
 
Specter27.2%
 
Other1.7%


ForestFlaherty49.9%
 
Specter49.6%
 
Other0.5%


FranklinFlaherty38.2%
 
Specter60.8%
 
Other1.1%


FultonFlaherty45.5%
 
Specter53.2%
 
Other1.3%


GreeneFlaherty69.5%
 
Specter29.7%
 
Other0.8%


HuntingdonFlaherty40.8%
 
Specter58.2%
 
Other1.0%


IndianaFlaherty54.9%
 
Specter44.3%
 
Other0.8%


JeffersonFlaherty53.3%
 
Specter46.0%
 
Other0.7%


JuniataFlaherty35.8%
 
Specter63.8%
 
Other0.4%


LackawannaFlaherty54.7%
 
Specter43.9%
 
Other1.4%


LancasterFlaherty27.5%
 
Specter71.5%
 
Other1.1%


LawrenceFlaherty65.1%
 
Specter34.0%
 
Other0.9%


LebanonFlaherty28.5%
 
Specter70.2%
 
Other1.3%


LehighFlaherty42.8%
 
Specter55.6%
 
Other1.6%


LuzerneFlaherty50.9%
 
Specter47.4%
 
Other1.7%


LycomingFlaherty42.6%
 
Specter56.2%
 
Other1.2%


McKeanFlaherty38.1%
 
Specter60.5%
 
Other1.4%


MercerFlaherty53.9%
 
Specter44.3%
 
Other1.8%


MifflinFlaherty42.5%
 
Specter56.0%
 
Other1.5%


MonroeFlaherty40.0%
 
Specter58.1%
 
Other2.0%


MontgomeryFlaherty31.3%
 
Specter67.3%
 
Other1.3%


MontourFlaherty43.0%
 
Specter56.3%
 
Other0.7%


NorthamptonFlaherty49.0%
 
Specter48.8%
 
Other2.2%


NorthumberlandFlaherty45.1%
 
Specter53.4%
 
Other1.5%


PerryFlaherty33.1%
 
Specter65.6%
 
Other1.3%


PhiladelphiaFlaherty48.2%
 
Specter50.0%
 
Other1.8%


PikeFlaherty35.3%
 
Specter62.9%
 
Other1.8%


PotterFlaherty36.8%
 
Specter61.8%
 
Other1.4%


SchuylkillFlaherty42.6%
 
Specter56.5%
 
Other0.9%


SnyderFlaherty29.2%
 
Specter70.1%
 
Other0.7%


SomersetFlaherty57.4%
 
Specter42.2%
 
Other0.5%


SullivanFlaherty40.3%
 
Specter58.9%
 
Other0.8%


SusquehannaFlaherty34.2%
 
Specter64.4%
 
Other1.4%


TiogaFlaherty33.5%
 
Specter65.0%
 
Other1.5%


UnionFlaherty32.7%
 
Specter65.6%
 
Other1.7%


VenangoFlaherty49.9%
 
Specter49.3%
 
Other0.8%


WarrenFlaherty40.7%
 
Specter57.6%
 
Other1.7%


WashingtonFlaherty71.4%
 
Specter27.9%
 
Other0.7%


WayneFlaherty32.9%
 
Specter65.6%
 
Other1.5%


WestmorelandFlaherty68.3%
 
Specter30.2%
 
Other1.5%


WyomingFlaherty33.1%
 
Specter65.7%
 
Other1.2%


YorkFlaherty37.5%
 
Specter61.0%
 
Other1.5%


National DataGraph for 1980 - Pennsylvania Results for 1980

Login

Terms of Use - DCMA Policy - Privacy Policy and Cookies


© Dave Leip's Atlas of U.S. Elections, LLC 2019 All Rights Reserved