1986 Secretary of State General Election Data Graphs - Massachusetts
by CountyData for this Contest was Contributed by on 2016-09-28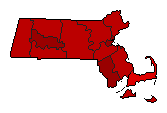
| Barnstable | Connolly | 56.9% | |
| Cochran | 43.1% | |
| Other | 0.0% | |
| Berkshire | Connolly | 69.0% | |
| Cochran | 31.0% | |
| Bristol | Connolly | 70.9% | |
| Cochran | 29.1% | |
| Dukes | Connolly | 68.1% | |
| Cochran | 31.9% | |
| Essex | Connolly | 66.9% | |
| Cochran | 33.1% | |
| Other | 0.0% | |
| Franklin | Connolly | 68.9% | |
| Cochran | 31.1% | |
| Other | 0.0% | |
| Hampden | Connolly | 67.4% | |
| Cochran | 32.6% | |
| Other | 0.0% | |
| Hampshire | Connolly | 70.8% | |
| Cochran | 29.2% | |
| Other | 0.0% | |
| Middlesex | Connolly | 69.4% | |
| Cochran | 30.6% | |
| Other | 0.0% | |
| Nantucket | Connolly | 64.4% | |
| Cochran | 35.6% | |
| Norfolk | Connolly | 64.3% | |
| Cochran | 35.7% | |
| Other | 0.0% | |
| Plymouth | Connolly | 62.9% | |
| Cochran | 37.1% | |
| Other | 0.0% | |
| Suffolk | Connolly | 77.9% | |
| Cochran | 22.0% | |
| Other | 0.0% | |
| Worcester | Connolly | 67.3% | |
| Cochran | 32.6% | |
| Other | 0.0% | |