1986 Gubernatorial General Election Data Graphs - New Mexico
Note: The Google advertisement links below may advocate political positions that this site does not endorse.
Data for this Contest was Contributed by on 2010-03-26
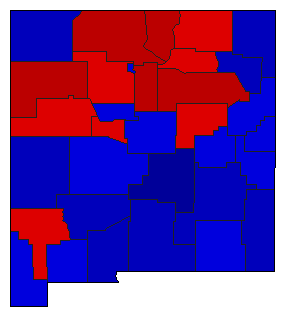
Map

BernalilloPowell46.3%
 
Carruthers53.7%


CatronPowell36.1%
 
Carruthers63.9%


ChavesPowell36.2%
 
Carruthers63.8%


CibolaPowell51.5%
 
Carruthers48.5%


ColfaxPowell53.8%
 
Carruthers46.2%


CurryPowell40.5%
 
Carruthers59.5%


De BacaPowell47.9%
 
Carruthers52.1%


Dona AnaPowell39.2%
 
Carruthers60.8%


EddyPowell49.5%
 
Carruthers50.5%


GrantPowell53.9%
 
Carruthers46.1%


GuadalupePowell56.6%
 
Carruthers43.4%


HardingPowell40.0%
 
Carruthers60.0%


HidalgoPowell40.7%
 
Carruthers59.3%


LeaPowell34.4%
 
Carruthers65.6%


LincolnPowell28.4%
 
Carruthers71.6%


Los AlamosPowell40.7%
 
Carruthers59.3%


LunaPowell41.4%
 
Carruthers58.6%


McKinleyPowell60.4%
 
Carruthers39.6%


MoraPowell55.5%
 
Carruthers44.5%


OteroPowell39.1%
 
Carruthers60.9%


QuayPowell42.9%
 
Carruthers57.1%


Rio ArribaPowell66.2%
 
Carruthers33.8%


RooseveltPowell40.1%
 
Carruthers59.9%


SandovalPowell51.5%
 
Carruthers48.5%


San JuanPowell38.8%
 
Carruthers61.2%


San MiguelPowell65.0%
 
Carruthers35.0%


Santa FePowell60.5%
 
Carruthers39.5%


SierraPowell32.8%
 
Carruthers67.2%


SocorroPowell48.8%
 
Carruthers51.2%


TaosPowell66.4%
 
Carruthers33.6%


TorrancePowell44.1%
 
Carruthers55.9%


UnionPowell39.4%
 
Carruthers60.6%


ValenciaPowell50.1%
 
Carruthers49.9%


National DataGraph for 1986 - New Mexico Results for 1986

Login

Terms of Use - DCMA Policy - Privacy Policy and Cookies


© Dave Leip's Atlas of U.S. Elections, LLC 2019 All Rights Reserved