1986 Senatorial General Election Data Graphs - South Carolina
by CountyData for this Contest was Contributed by on 2011-03-12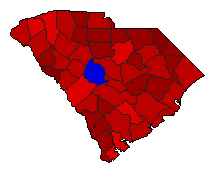
| Abbeville | Hollings | 75.9% | |
| McMaster | 23.3% | |
| Other | 0.8% | |
| Aiken | Hollings | 53.8% | |
| McMaster | 45.1% | |
| Other | 1.1% | |
| Allendale | Hollings | 79.2% | |
| McMaster | 19.4% | |
| Other | 1.3% | |
| Anderson | Hollings | 61.3% | |
| McMaster | 37.7% | |
| Other | 1.0% | |
| Bamberg | Hollings | 74.9% | |
| McMaster | 24.5% | |
| Other | 0.6% | |
| Barnwell | Hollings | 66.5% | |
| McMaster | 32.5% | |
| Other | 1.0% | |
| Beaufort | Hollings | 51.3% | |
| McMaster | 45.7% | |
| Other | 3.0% | |
| Berkeley | Hollings | 61.1% | |
| McMaster | 36.7% | |
| Other | 2.2% | |
| Calhoun | Hollings | 64.5% | |
| McMaster | 35.0% | |
| Other | 0.6% | |
| Charleston | Hollings | 62.6% | |
| McMaster | 35.4% | |
| Other | 2.0% | |
| Cherokee | Hollings | 73.8% | |
| McMaster | 25.0% | |
| Other | 1.2% | |
| Chester | Hollings | 73.3% | |
| McMaster | 25.9% | |
| Other | 0.8% | |
| Chesterfield | Hollings | 74.7% | |
| McMaster | 24.6% | |
| Other | 0.7% | |
| Clarendon | Hollings | 72.9% | |
| McMaster | 25.8% | |
| Other | 1.2% | |
| Colleton | Hollings | 65.2% | |
| McMaster | 33.2% | |
| Other | 1.6% | |
| Darlington | Hollings | 67.3% | |
| McMaster | 31.1% | |
| Other | 1.6% | |
| Dillon | Hollings | 78.4% | |
| McMaster | 20.4% | |
| Other | 1.1% | |
| Dorchester | Hollings | 59.6% | |
| McMaster | 38.8% | |
| Other | 1.6% | |
| Edgefield | Hollings | 67.7% | |
| McMaster | 31.4% | |
| Other | 0.9% | |
| Fairfield | Hollings | 76.0% | |
| McMaster | 22.4% | |
| Other | 1.6% | |
| Florence | Hollings | 67.6% | |
| McMaster | 31.6% | |
| Other | 0.8% | |
| Georgetown | Hollings | 69.4% | |
| McMaster | 29.2% | |
| Other | 1.4% | |
| Greenville | Hollings | 56.4% | |
| McMaster | 42.6% | |
| Other | 1.0% | |
| Greenwood | Hollings | 63.3% | |
| McMaster | 34.7% | |
| Other | 2.0% | |
| Hampton | Hollings | 76.5% | |
| McMaster | 22.5% | |
| Other | 1.0% | |
| Horry | Hollings | 65.9% | |
| McMaster | 33.2% | |
| Other | 1.0% | |
| Jasper | Hollings | 72.5% | |
| McMaster | 26.0% | |
| Other | 1.4% | |
| Kershaw | Hollings | 58.7% | |
| McMaster | 40.1% | |
| Other | 1.2% | |
| Lancaster | Hollings | 72.1% | |
| McMaster | 27.1% | |
| Other | 0.8% | |
| Laurens | Hollings | 68.4% | |
| McMaster | 30.9% | |
| Other | 0.8% | |
| Lee | Hollings | 70.3% | |
| McMaster | 28.9% | |
| Other | 0.8% | |
| Lexington | Hollings | 48.3% | |
| McMaster | 50.7% | |
| Other | 1.1% | |
| McCormick | Hollings | 80.2% | |
| McMaster | 18.9% | |
| Other | 0.8% | |
| Marion | Hollings | 79.4% | |
| McMaster | 19.9% | |
| Other | 0.8% | |
| Marlboro | Hollings | 83.2% | |
| McMaster | 15.8% | |
| Other | 0.9% | |
| Newberry | Hollings | 64.7% | |
| McMaster | 34.7% | |
| Other | 0.6% | |
| Oconee | Hollings | 63.6% | |
| McMaster | 35.1% | |
| Other | 1.3% | |
| Orangeburg | Hollings | 68.8% | |
| McMaster | 30.6% | |
| Other | 0.6% | |
| Pickens | Hollings | 55.3% | |
| McMaster | 43.7% | |
| Other | 1.0% | |
| Richland | Hollings | 62.1% | |
| McMaster | 36.5% | |
| Other | 1.5% | |
| Saluda | Hollings | 65.5% | |
| McMaster | 33.7% | |
| Other | 0.8% | |
| Spartanburg | Hollings | 61.6% | |
| McMaster | 36.3% | |
| Other | 2.0% | |
| Sumter | Hollings | 61.6% | |
| McMaster | 36.8% | |
| Other | 1.7% | |
| Union | Hollings | 72.2% | |
| McMaster | 27.0% | |
| Other | 0.8% | |
| Williamsburg | Hollings | 74.2% | |
| McMaster | 25.1% | |
| Other | 0.7% | |
| York | Hollings | 61.9% | |
| McMaster | 37.4% | |
| Other | 0.7% | |