1988 Senatorial General Election Data Graphs - Massachusetts
by CountyData for this Contest was Contributed by on 2010-01-18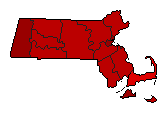
| Barnstable | Kennedy | 59.9% | |
| Malone | 39.2% | |
| Other | 0.9% | |
| Berkshire | Kennedy | 74.4% | |
| Malone | 24.1% | |
| Other | 1.5% | |
| Bristol | Kennedy | 69.7% | |
| Malone | 29.2% | |
| Other | 1.1% | |
| Dukes | Kennedy | 71.9% | |
| Malone | 26.4% | |
| Other | 1.7% | |
| Essex | Kennedy | 63.4% | |
| Malone | 35.6% | |
| Other | 1.0% | |
| Franklin | Kennedy | 68.1% | |
| Malone | 30.8% | |
| Other | 1.1% | |
| Hampden | Kennedy | 64.8% | |
| Malone | 33.8% | |
| Other | 1.4% | |
| Hampshire | Kennedy | 68.5% | |
| Malone | 30.1% | |
| Other | 1.5% | |
| Middlesex | Kennedy | 65.2% | |
| Malone | 33.8% | |
| Other | 1.1% | |
| Nantucket | Kennedy | 67.3% | |
| Malone | 31.1% | |
| Other | 1.6% | |
| Norfolk | Kennedy | 62.3% | |
| Malone | 36.8% | |
| Other | 0.9% | |
| Plymouth | Kennedy | 60.2% | |
| Malone | 38.8% | |
| Other | 1.0% | |
| Suffolk | Kennedy | 70.3% | |
| Malone | 28.3% | |
| Other | 1.5% | |
| Worcester | Kennedy | 63.6% | |
| Malone | 35.4% | |
| Other | 1.0% | |