1990 Secretary of State General Election Data Graphs - Florida
Note: The Google advertisement links below may advocate political positions that this site does not endorse.
Data for this Contest was Contributed by on 2007-05-09
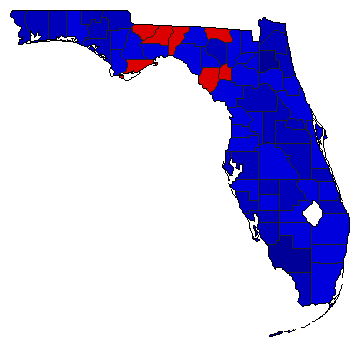
Map

AlachuaMinter46.1%
 
Smith53.9%


BakerMinter42.4%
 
Smith57.6%


BayMinter37.9%
 
Smith62.1%


BradfordMinter46.2%
 
Smith53.8%
 
Other0.0%


BrevardMinter40.7%
 
Smith59.3%
 
Other0.0%


BrowardMinter47.4%
 
Smith52.6%
 
Other0.0%


CalhounMinter42.2%
 
Smith57.8%


CharlotteMinter37.9%
 
Smith62.1%


CitrusMinter42.6%
 
Smith57.4%


ClayMinter29.6%
 
Smith70.3%
 
Other0.0%


CollierMinter28.7%
 
Smith71.3%


ColumbiaMinter41.3%
 
Smith58.7%


DeSotoMinter42.5%
 
Smith57.5%


DixieMinter55.8%
 
Smith44.2%


DuvalMinter37.7%
 
Smith62.3%
 
Other0.0%


EscambiaMinter34.8%
 
Smith65.2%
 
Other0.0%


FlaglerMinter41.1%
 
Smith58.9%
 
Other0.0%


FranklinMinter52.1%
 
Smith47.9%


GadsdenMinter50.9%
 
Smith49.1%


GilchristMinter50.8%
 
Smith49.2%


GladesMinter48.0%
 
Smith51.6%
 
Other0.4%


GulfMinter44.7%
 
Smith55.3%


HamiltonMinter52.4%
 
Smith47.6%


HardeeMinter38.1%
 
Smith61.9%


HendryMinter41.1%
 
Smith58.9%


HernandoMinter44.4%
 
Smith55.6%


HighlandsMinter37.8%
 
Smith62.2%
 
Other0.0%


HillsboroughMinter38.9%
 
Smith61.1%
 
Other0.0%


HolmesMinter36.8%
 
Smith63.2%


Indian RiverMinter35.5%
 
Smith64.5%


JacksonMinter37.2%
 
Smith62.8%


JeffersonMinter51.5%
 
Smith48.5%


LafayetteMinter43.9%
 
Smith56.1%


LakeMinter34.1%
 
Smith65.9%


LeeMinter33.7%
 
Smith66.2%
 
Other0.1%


LeonMinter50.2%
 
Smith49.7%
 
Other0.0%


LevyMinter44.9%
 
Smith55.0%
 
Other0.1%


LibertyMinter46.9%
 
Smith53.1%


MadisonMinter46.6%
 
Smith53.4%


ManateeMinter40.5%
 
Smith59.3%
 
Other0.2%


MarionMinter37.1%
 
Smith62.9%
 
Other0.0%


MartinMinter31.3%
 
Smith68.7%


Miami-DadeMinter43.2%
 
Smith56.8%


MonroeMinter39.9%
 
Smith60.1%
 
Other0.0%


NassauMinter39.2%
 
Smith60.8%


OkaloosaMinter34.5%
 
Smith65.5%
 
Other0.0%


OkeechobeeMinter44.5%
 
Smith55.5%


OrangeMinter37.2%
 
Smith62.8%
 
Other0.0%


OsceolaMinter37.3%
 
Smith62.7%


Palm BeachMinter44.8%
 
Smith55.2%


PascoMinter44.8%
 
Smith55.2%
 
Other0.0%


PinellasMinter38.2%
 
Smith61.8%
 
Other0.0%


PolkMinter44.4%
 
Smith55.6%
 
Other0.0%


PutnamMinter48.6%
 
Smith51.4%


St. JohnsMinter33.8%
 
Smith66.2%


St. LucieMinter44.1%
 
Smith55.9%


Santa RosaMinter34.1%
 
Smith65.9%
 
Other0.0%


SarasotaMinter33.2%
 
Smith66.8%


SeminoleMinter33.3%
 
Smith66.7%


SumterMinter42.9%
 
Smith57.1%


SuwanneeMinter39.2%
 
Smith60.8%


TaylorMinter44.9%
 
Smith55.1%


UnionMinter47.8%
 
Smith52.2%


VolusiaMinter43.3%
 
Smith56.7%


WakullaMinter43.4%
 
Smith56.5%
 
Other0.2%


WaltonMinter41.8%
 
Smith58.2%


WashingtonMinter38.4%
 
Smith61.6%


National DataGraph for 1990 - Florida Results for 1990

Login

Terms of Use - DCMA Policy - Privacy Policy and Cookies


© Dave Leip's Atlas of U.S. Elections, LLC 2019 All Rights Reserved