1990 Secretary of State General Election Data Graphs - Massachusetts
by CountyData for this Contest was Contributed by on 2016-09-26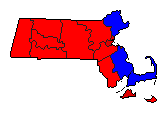
| Barnstable | Connolly | 38.3% | |
| McCarthy | 47.5% | |
| Ahearn | 14.1% | |
| Other | 0.0% | |
| Berkshire | Connolly | 49.3% | |
| McCarthy | 34.8% | |
| Ahearn | 15.9% | |
| Other | 0.0% | |
| Bristol | Connolly | 47.7% | |
| McCarthy | 36.8% | |
| Ahearn | 15.4% | |
| Other | 0.0% | |
| Dukes | Connolly | 50.4% | |
| McCarthy | 33.6% | |
| Ahearn | 16.0% | |
| Other | 0.0% | |
| Essex | Connolly | 42.1% | |
| McCarthy | 43.4% | |
| Ahearn | 14.4% | |
| Other | 0.0% | |
| Franklin | Connolly | 43.1% | |
| McCarthy | 40.6% | |
| Ahearn | 16.0% | |
| Other | 0.3% | |
| Hampden | Connolly | 47.9% | |
| McCarthy | 35.1% | |
| Ahearn | 17.0% | |
| Other | 0.0% | |
| Hampshire | Connolly | 49.3% | |
| McCarthy | 33.2% | |
| Ahearn | 17.5% | |
| Other | 0.0% | |
| Middlesex | Connolly | 45.5% | |
| McCarthy | 37.5% | |
| Ahearn | 17.0% | |
| Other | 0.0% | |
| Nantucket | Connolly | 43.8% | |
| McCarthy | 41.2% | |
| Ahearn | 15.0% | |
| Norfolk | Connolly | 46.7% | |
| McCarthy | 38.0% | |
| Ahearn | 15.3% | |
| Other | 0.0% | |
| Plymouth | Connolly | 39.9% | |
| McCarthy | 45.7% | |
| Ahearn | 14.4% | |
| Other | 0.0% | |
| Suffolk | Connolly | 59.4% | |
| McCarthy | 24.2% | |
| Ahearn | 16.4% | |
| Other | 0.0% | |
| Worcester | Connolly | 44.2% | |
| McCarthy | 40.2% | |
| Ahearn | 15.3% | |
| Other | 0.2% | |