1990 Attorney General General Election Data Graphs - Massachusetts
by CountyData for this Contest was Contributed by on 2016-09-26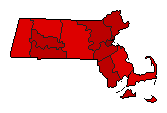
| Barnstable | Harshbarger | 54.0% | |
| Sawyer | 46.0% | |
| Other | 0.0% | |
| Berkshire | Harshbarger | 59.4% | |
| Sawyer | 40.5% | |
| Other | 0.1% | |
| Bristol | Harshbarger | 62.7% | |
| Sawyer | 37.2% | |
| Other | 0.1% | |
| Dukes | Harshbarger | 62.7% | |
| Sawyer | 37.3% | |
| Other | 0.1% | |
| Essex | Harshbarger | 62.0% | |
| Sawyer | 37.9% | |
| Other | 0.0% | |
| Franklin | Harshbarger | 59.6% | |
| Sawyer | 40.1% | |
| Other | 0.3% | |
| Hampden | Harshbarger | 66.6% | |
| Sawyer | 33.4% | |
| Other | 0.0% | |
| Hampshire | Harshbarger | 66.9% | |
| Sawyer | 33.1% | |
| Other | 0.1% | |
| Middlesex | Harshbarger | 68.8% | |
| Sawyer | 31.2% | |
| Other | 0.0% | |
| Nantucket | Harshbarger | 57.2% | |
| Sawyer | 42.8% | |
| Norfolk | Harshbarger | 64.7% | |
| Sawyer | 35.3% | |
| Other | 0.0% | |
| Plymouth | Harshbarger | 55.3% | |
| Sawyer | 44.7% | |
| Other | 0.0% | |
| Suffolk | Harshbarger | 76.0% | |
| Sawyer | 24.0% | |
| Other | 0.0% | |
| Worcester | Harshbarger | 56.5% | |
| Sawyer | 43.5% | |
| Other | 0.0% | |